
Design and deployment are undoubtedly crucial stages in developing a successful 5-star mobile app. The real key to success lies in evaluating the right metrics and optimizing your application to achieve your specific target goals.
It’s also important for you to define success! For some companies, it might mean better brand recognition. For others, success could mean increased revenue or more customer engagement.
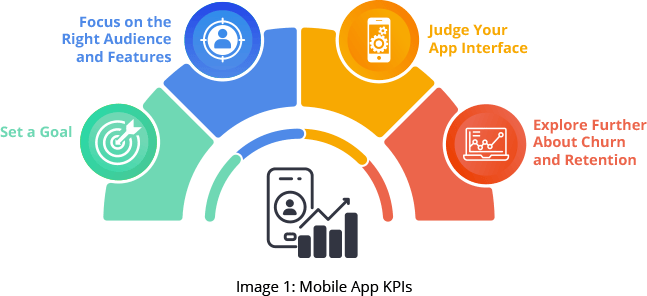
The Importance of Mobile App KPIs for Measuring Success
A mobile app KPI is a metric that measures the performance of a mobile application, such as user engagement, downloads, and retention. With the aid of mobile app KPIs, you can evaluate the state of your company's development and take appropriate action. For instance, if your active user base is shrinking, it can be a sign that a marketing plan is ineffective. Regular evaluation of KPIs provides insights into how well your app is performing, enabling you to identify areas of improvement and increase revenue. By tracking KPIs, you can also determine the overall value of your app, which can be crucial in attracting potential customers, investors, and shareholders.
How KPI Tracking Can Improve User Engagement and Retention in Mobile Apps
Incorporating app KPI tracking directly into your development process can be highly beneficial. The KPI system offers an excellent context for evaluating app performance and making strategic decisions. It is a perfect tool for monitoring and managing user activity.
It allows you to track key metrics related to user behavior, such as session length, frequency, and feature usage. With this information, you can optimize your app and focus on areas that are most important to your users, resulting in increased user satisfaction and overall success
The KPI system complements the financial statement results. KPI metrics can provide an additional layer of information about the financial performance of your business, providing deeper insight into the quantitative data presented in its financial statements.
Proper KPI metrics can show the variance between actual and anticipated results. It also offers information that can lead to activity enhancement. Finally, KPI tracking examines the consistency between the chosen actions and business goals.
A thoughtful KPI mechanism in place should be able to answer the following business questions:
- What entices users to visit the mobile website or app?
- How long do visitors usually stay?
- What features do they use?
- Where do users run into issues?
- What variables are associated with decisions like purchases?
- What influences increased use and sustained retention?
Let’s now look at specific details on essential mobile app KPIs.
App Performance KPIs
Measuring the performance of a mobile app is critical for its success as it allows you to track and analyze data, such as user engagement, app crashes, and the overall user experience. This data can then be used to make informed decisions to optimize the app, ensure a seamless user experience, and drive more downloads and greater user retention. Through performance metrics, developers can identify and address any issues hindering the app’s growth and gauge user needs and preferences.
Table 1 summarizes app performance KPIs.
| KPI | Discussion |
|---|---|
User Growth Rate Mobile Downloads Retention Rate Installations Uninstallations Subscriptions Crashes | Track the user growth rate to check if and how your user base is expanding. The most straightforward approach to gauge an app's user popularity is to look at how frequently it is downloaded. The number of users returning after a certain amount of time. The higher the retention rate, the more positive implications for future earnings. Just because someone downloaded an app doesn't guarantee they finished the setup. Track actual installations on different devices. Track uninstallations and analyze what happened if they coincide with an upgrade or changes. Track how many joiners later unsubscribe. Track the average subscription term and how long it takes to subscribe after installing. Track the number of crashes and where they occur to enhance performance, user experience, and retention. |
Here's a formula that will help you calculate your user growth rate:
((Present User Amount – Past User Amount) / (Past User Amount)) X 100
User Experiences
User experience metrics can help identify areas of improvement, inform design decisions, and track the app's success as changes are made. By understanding user experience, you can identify new features or areas for future growth. Armed with this information, you can build your app to provide an enjoyable experience for users.
Load Time
Load time is how long it takes for an app to load before it can be used once opened. It also pertains to in-app displays and how quickly users move between panels or activities. The quicker the software loads, the better the user experience it offers. As a general rule, keep your load times as short as possible.
Devices
Which devices your audience uses to access our app is another straightforward KPI to identify and monitor. It's important to understand how often your target audience uses tablets instead of smartphones, Android over iOS, or other devices depending on application context. Screen resolution and dimensions, permissions and API latency, battery consumption, and error rate are other key factors to view and analyze to achieve better performance.
App Engagement Metrics
An accurate understanding of user engagement can determine the success of an app and allow you to identify opportunities for optimization. By measuring how often users interact with their apps and how they use and respond to features, you can craft a better user experience and increase the likelihood of customer retention.
Engagement is a complex metric, so this blog divides the topic into three subsections. Session metrics pertain to the contiguous time interval during which a user interacts with the app. Business metrics give you a view of how user engagement impacts revenue. The last subsection outlines other important user engagement metrics.
Let’s first have a look at session metrics.
Sessions
A session in the context of a mobile app is when a user interacts with the app in a single continuous period, typically including multiple touches and interactions with app features. In digital analytics, a session is a collection of the user or device-specific activities on our website or app over a given period. Therefore, clarifying what a session implies for our specific app or project is crucial.
Stickiness
Our app's stickiness" and popularity are measured by the number of sessions it generates. “Stickiness” is often defined as the number of times a user opens the app. The more sessions a user generates and an app obtains, the better.
This formula will assist you in determining stickiness:
Stickiness = daily active users (DAU)/monthly active users (MAU)
Session Length
Session length gives you the average session length for app users. Generally, the more time a user spends using the app, the better. However, you could also look at session length to see if there is a link between it and the frequency of crashes and uninstallations.
Depending on the functionality and objective of your app, you might deliberately shorten the path to a sales conversion. A shorter session is also appropriate when you want the user to perform another important action. In that situation, tracking the number of session intervals or session depth would be more beneficial.
Session Interval
Session interval measures the time that passes between sessions. For instance, do people visit every day, once a week, or many times per day? In general, shorter gaps are preferable. This KPI for mobile applications can also be connected to content revisions or other relevant occasions to consider with your app.
In contrast, shorter session intervals could be preferable if your app isn't bound to a specific time of day or event. For instance, if there is new material to watch every morning, your session intervals will likely be around 24 hours.
Session Depth
Session depth tracks the number of interactions per session or the length of the user journey before a session or app is closed. For instance, switching between browsing and making a purchase, or leveling up in a game, may indicate a deeper session than simply signing in to check for new material or utilizing an app that only has to be used for a brief period of time, such a picture editor or calculator.
Business Metrics
Understanding business metrics is essential for any mobile app. It allows you to measure ROI and make informed decisions about further development. Metrics such as average revenue per user, lifetime value, acquisition cost, and purchases can highlight an app's fiscal performance and identify improvement areas.
Average Revenue Per User
The average revenue per user measures the sum of money or value earned by each user via subscriptions, in-app purchases, ad impressions or clicks, paid downloads, or other types of monetization. This statistic provides a solid general notion of the app's worth when multiplied by the size of the user base or the number of active users.
Lifetime Value
The amount of money a user has brought in via your software is known as its lifetime value. It may be a superb approach to estimate an app's real potential income or worth, especially when combined with the average revenue per user.
Lifetime Value = Average Conversion Value X Average Conversions Per Time Period X Average Customer Lifetime
Acquisition Cost
Customers find your app through many avenues, including in-app referrals, paid advertisements, word-of-mouth, organic search via the App Store, and sponsored campaigns. With the help of the acquisition cost metric, you observe where users are coming from and how they act after they begin using your app. The amount of app downloads from specific sources is significant but less substantial than the value users derive from the app while actively using it.
Purchase Lag
This is a straightforward and important statistic to monitor if your app involves any financial exchange through in-app purchases, upgrades to a premium version, subscriptions, or an e-commerce endeavor.
This mobile app KPI measures how long it takes a user to purchase after downloading and installing the app, whether it's an in-app purchase, an e-commerce transaction, or purchasing a premium or otherwise enhanced version.
This formula will help you to determine the purchase lag for your apps:
Purchase Lag = Time/Date of First Purchase - Time/Date of Registration (in days)
Other Important Engagement KPIs
Table 2 summarizes other meaningful app KPIs that pertain to engagement:
| KPI | Discussion |
|---|---|
Daily Active Users (DAU) Average Screens Per Visit Monthly Active Users Social Shares Churn Rate | Measure potential future development worth by tracking the average number of DAUs. Gauges the average number of distinct pages a person accesses during a visit. Shows how many people actively use the app each month. How frequently people promote or post about your app on social media. Shows how frequently current users unsubscribe or remove the app. Low churn is ideal. |
- Miscellaneous Marketing KPIs — The install source KPI for mobile apps is a metric that measures how successful an app is at acquiring new users through installation sources such as app stores, websites, and other sources. The demographics KPI is the number of active users in a given period.
- App Store KPIs — Keywords, reviews, and ratings are all essential mobile app store metrics. Keywords help to boost app visibility and ranking in app stores. At the same time, reviews and ratings give you an idea about how satisfied users are with the app.
Summary
Creating a successful mobile app requires a thorough understanding of user engagement metrics and incorporating app KPI tracking into the development process. Perhaps the most crucial thing to remember is that creating mobile apps is an iterative process. A great brand continuously tries new ideas and gathers information about its audience. Companies constantly use analytics to learn more about their consumers and their experiences.
You can determine the likely path a given consumer will follow after you understand your users’ normal trends and journeys. Depending on the audience type a user belongs to, you can tailor your messaging and scheduling to assist or lead them through a path that makes sense for them. Understanding user behavior enables you to fully tailor your marketing messages and provide them with the most value. Behavioral data lets you detect which trigger points imply an increased propensity to act. This knowledge enables you to develop a smooth path toward sales.