
Spreadsheet programs such as Excel or Open Office have limitations on the amount of data they can analyze at one time. Hence, they have no capability to visualize risks and trends. Anyone who has worked with spreadsheets is well aware that these applications provide an ability to export the data into a text representation known as CSV. This blog looks at how to properly validate CSV files of any size.
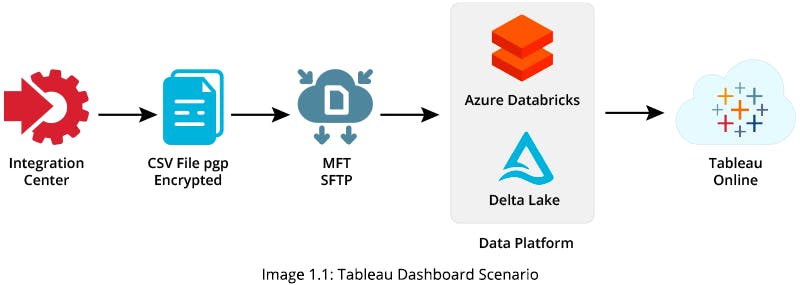
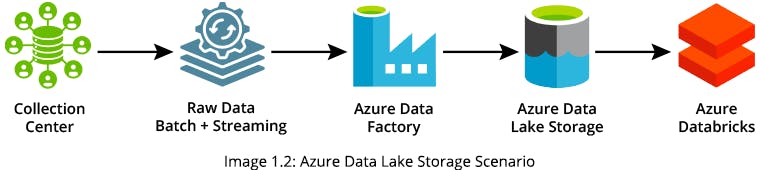
In order to provide a Tableau Dashboard, you can upload original CSV files via SFTP (SSH File Transfer Protocol) into an Azure Data Factory (ADF) pipeline. You can use the pipelined data to generate a target table in Azure Data Lake Storage (ADLS) and build your Tableau Dashboard using the target table data
But, how do you test the data generated in target tables against the original CSV source data in this scenario?
Solution
Since each CSV file has millions of records, you cannot test it manually because it would be exhaustive and can only be done on sample data.
To bypass this constraint, you can automate project testing using Python pandas, PySpark, and Databricks-connect libraries.
The advantage of using Python in this scenario is that it has many libraries, like pandas and PySpark, that make data comparison between the source and target records effortless and efficient, saving a lot of time and effort.
Pandas is an open-source data analysis library that supports data analysis and manipulation. PySpark offers an interface to Apache Spark and provides for distributed data queries. It also provides access to Spark features such as Spark SQL, DataFrame, Streaming, and MLlib (machine learning library). Databricks-connect is a library that allows Python apps to run Spark jobs directly.
Types of validation you can now perform on the complete dataset include:
- Validating whether the number of records and columns between source and target tables matches
- Finding duplicates in both source and target data
- Finding corrupt data
- Performing data comparison between the source and target
It’s difficult to quantify what it means for a business to find corrupt data. However, one example might be an invalid date where the recorded year is 0004. If such data corruption is not detected and handled, an ADF pipeline could quickly fail.
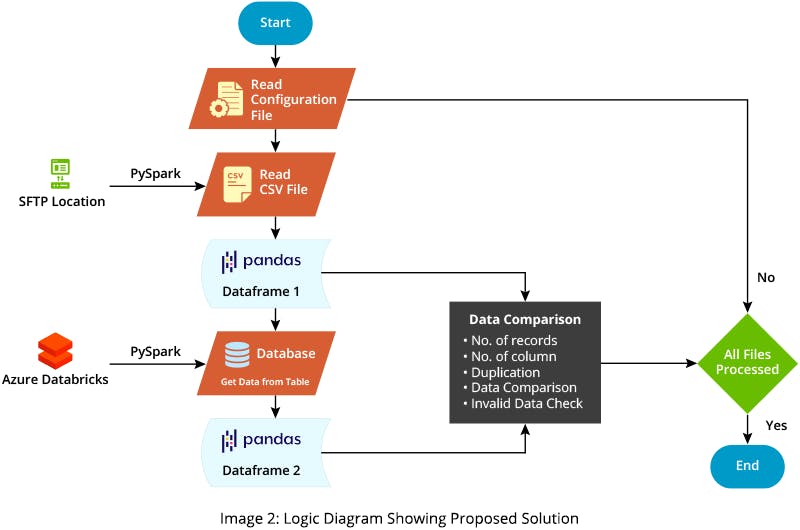
To fetch data to a target table from data lake, use the PySpark library that leverages the Databricks-connect library. You can then use the Python pandas library for further processing, including functions like shape, duplicate, and merge. These functions allow you to easily find all discrepancies in data between the source and target.
Here is an example of how you might perform discrepancy testing:
- Read a CSV file and convert it to pandas DataFrame (Source Data):
from PropertyReader import propertyReader
import pandas as pd
sFile = pd.read_csv(propertyReader('source_file_location') + fileName, keep_default_na
=False) - Read data from the target table using PySpark and convert it to pandas DataFrame (Target Data)
from pyspark.sql import SparkSession
import numpy as np
spark = SparkSession.builder.config("spark.driver.memory", "40g").config("spark.
executor.memory", "25g").config("spark.rpc.message.maxSize", "512").getOrCreate()
Pyspark_df = spark.sql(sqlQuery)
df = Pyspark_df.dtypes
tableInfo = dict(df)
colList= list(tableInfo.keys())
pd = Pyspark_df.select(colList).toPandas() pd = pd.replace([None], [''], regex=True)
pd = pd.replace([np.nan], [''], regex=True)
# Save target Table in csv file
pd.to_csv('positionTarget' + '.csv', header=True, index=False) - Perform a row count match:
def row_count_match(pd, sFile):
if pd.shape[0] == sFile.shape[0]:
print("Source row count are matching with target")
print("Source Count:", sFile.shape[0], "\nTarget Count:", pd.shape[0])
else:
print(f"{bcolors.FAIL}Source count are not matching with target{bcolors.RESET}")
print("Source Count:", sFile.shape[0], "\nTarget Count:", pd.shape[0]) - Perform a column count match:
def column_count_match(pd, sFile):
# Checking the Column count
print()
if pd.shape[1] == sFile.shape[1]:
print("Source Column count are matching with target")
print("Source Count:", sFile.shape[1], "\nTarget Count:", pd.shape[1])
else:
print(f"{bcolors.FAIL}Source Column count are not matching with target
{bcolors.RESET}") print("Source Count:", sFile.shape[1], "\nTarget Count:",
pd.shape[1]) - Check for duplicate records and store them in another file with the duplicate row number:
def dedup_checker(sFile, pd, SourceFileName):
dupSrc = sFile[sFile.duplicated()]
dup = []
print("Validating duplicate values in Source and Target")
if dupSrc.shape[0] == 0:
print("No Duplicate found")
else:
dupSrc.index.rename('Row ID', inplace=True)
dupSrc.index = dupSrc.index + 2 print("Number of duplicate record found in source:
", dupSrc.shape[0]) dupSrc.to_csv("diff/" + SourceFileName.split('.')[0] +
'_dedup.csv') print("Duplicate records from Source are updated in output folder.")
dupTarget = pd[pd.duplicated()]
if dupTarget.shape[0] == 0:
print("No Duplicate Record found")
else:
dupTarget.index = dupTarget.index + 2 dupTarget.index.rename('Row Id', inplace=True)
print("Number of duplicate record found in target:", dupTarget.shape[0])
dupTarget.to_csv("diff/" + SourceFileName.split('.')[0] + '_Target_dedup.csv')
print("Duplicate records from Target are updated in output folder.") - Find differences between the source and target, and store any differences detected in another CSV file:
def write_difference_data(sFile,pd, SourceFileName):
for column in sFile.columns: if sFile[column].dtypes == 'object' and pd[column].
dtypes == 'int64': sFile[column]=sFile[column].astype(np.int64) elif sFile[column]
.dtypes == 'int64' and pd[column].dtypes =='object': pd[column]=pd[column].astype
(np.int64)
lh=pd.merge(sFile, pd, how='left', indicator=True) \ .query("_merge == 'left_only'")
\ .drop('_merge',1)
if(lh.shape[0]!=0): lh.index.rename('Row ID', inplace=True) lh.index = lh.index + 2
lh.to_csv('diff/' + SourceFileName.split('.')[0] + 'left_mismatch.csv')
rh=pd.merge(sFile, pd, how='right', indicator=True) \ .query("_merge ==
'right_only'") \ .drop('_merge',1)
if(rh.shape[0]!=0): rh.index.rename('Row ID', inplace=True) rh.index =
rh.index + 2 rh.to_csv('diff/' + SourceFileName.split('.')[0] + 'right_mismatch.csv')
Using this methodology, you can report and compare all inconsistent data in each file within a few hours rather than one or more days. This methodology also enables business teams to correct the data wherever required, allowing you to test CSV data on more than 20 files within a couple of weeks, using minimum resources and time.