
Identifying persona is key to establishing realistic data observability within your business’ IT infrastructure. A persona is a role within an IT infrastructure that includes a data engineer, an end customer, or a business user. Once the personas are defined, you can establish ways to accomplish observability reporting. This blog explains how you can deploy different pipelines and data health dashboards for selected personas.
What is Data Observability?
Data observability refers to monitoring, understanding, and troubleshooting data pipelines in real-time. It involves tracking metrics that indicate the health and performance of data systems, identifying and resolving issues as they arise, and ensuring data accuracy and consistency across the organization. Data observability is crucial for the success of your business because it allows you to make data-driven decisions confidently, minimize data downtime and errors, improve data quality, and respond quickly to changing business needs. Without data observability, you risk making inaccurate or incomplete decisions based on faulty data, which can have serious consequences for your bottom line.
In our experience, data observability can be broken down into five fundamental categories:
- Pipeline Health
- Data Health
- Platform Health
- Domain Health
- Business Health
The scope of this document is restricted to pipeline and data health. We cover problem statements for different personas, observability reporting solutions for those problems, and value-added solutions.
Before deep diving into various personas and their problem statements, you must first understand what is meant by pipeline health and data health. Table 1 below summarizes these two important concepts.
| Pipeline Health | Data Health |
|---|---|
Observes the health of data pipeline jobs configured across various data layers | Measures or validates data quality transmitted across data layers designed per a company's architecture |
Reporting Solutions, Platforms, and Personas
In our experience, pipeline, and data health reporting solutions often use web apps and Tableau dashboards. Table 2 summarizes these two.
| Platform | Description |
|---|---|
Web Apps | Dashboards built using React.js framework, providing an overview of pipeline health and data freshness. |
Tableau | Provides deep analysis for technical persona with statistical and cause-and-effect analyses. |
Table 3 shows the most frequent mapping between platform, dashboard, and personas.
| Platform | Dashboards | Persona |
|---|---|---|
Web App | Business Dashboard | Business Users |
Tableau | Data Health Dashboard, Pipeline Health Dashboard | Production Support Engineers, Technical Product Managers, Data Analysts |
Now, let us look at how you may put these dashboards to good use.
Dashboard: Pipeline Health Tableau
- Persona — Production Support Engineer
- Use Case — A day in the life of a Site Reliability Engineer (SRE) who is responsible for daily monitoring and communicating unexpected behavior
- Reporting Solution — Pipeline health Tableau dashboard
Persona Story
Here is the support engineer’s statement:
As a support engineer, I am responsible for the daily monitoring of data pipeline jobs that fall into my shift timings. One of my primary tasks is to observe the coordination and communications with stakeholders in case any issues are identified, such as job failure or delay. I also perform root cause analysis and troubleshoot problems.
The pipeline health tableau dashboard provides the support engineer with insights so they can do their job effectively.
Dashboard Capabilities
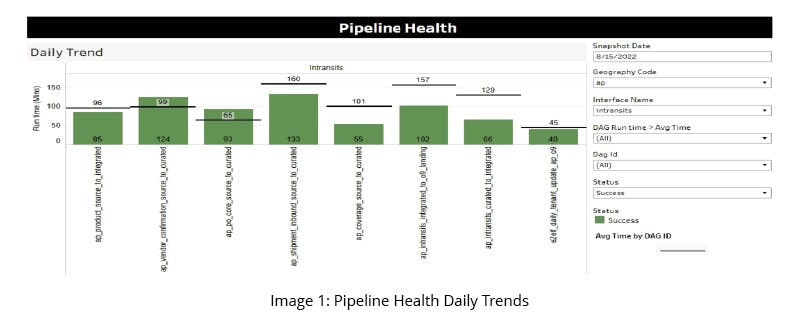
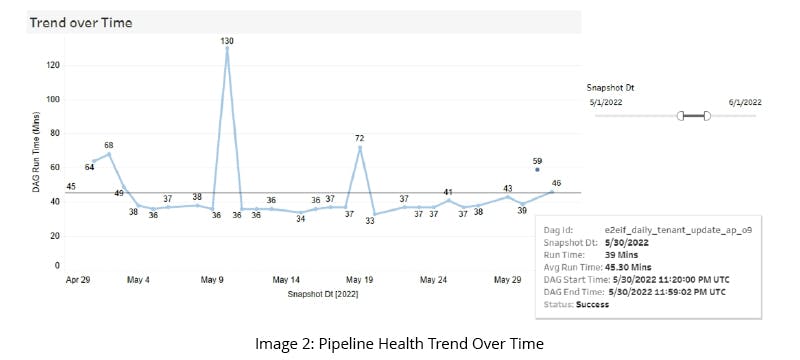
In this context, the dashboard needs to provide a list of Directed Acyclic Graph (DAGs) and their execution statistics for a data product, along with average completion time. Job execution trends over a period of time can provide insights into which job is deviated from its normal execution on a given day.
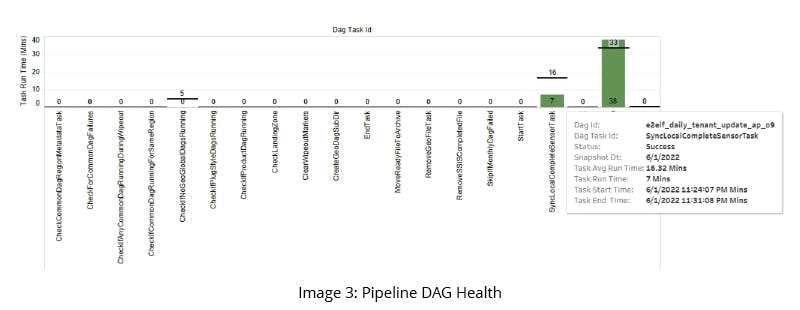
The dashboard can also provide insights into underlying tasks or steps the data pipeline job executes. The overall pipeline health dashboard provides faster RCA and quick response time and saves monitoring time and effort.
Dashboard Visualizations
Dashboard: Pipeline Health Business
- Persona — Support Engineer, Business User
- Use Case — An o9 business user needs to know the status of data feeds before they start planning their activities
- Reporting Solution — Pipeline health business dashboard
The pipeline health tableau dashboard provides in-depth insights for the support engineer persona. A lighter pipeline health flavor is also specific to the business user persona.
Persona Story
The business user’s statement:
I am an Asia-Pacific (APAC) business user and planner and expect the latest and greatest data to be available in downstream applications from planning activities. But I wonder whether I am confident about using the data?”
The pipeline health business dashboard provides that answer!
Dashboard Capabilities
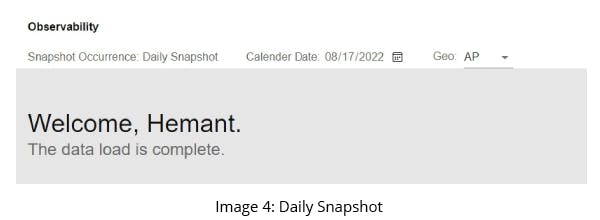
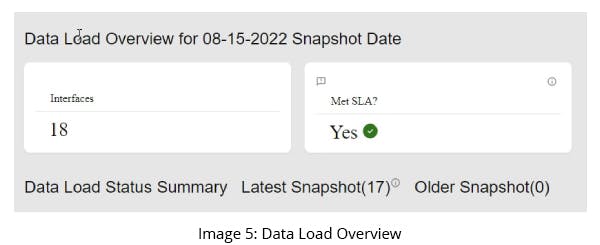
The pipeline health business dashboard provides visibility on the completion status of all data pipeline jobs finished within the defined business SLA. It’s important that the business user is aware of any jobs that failed to complete.
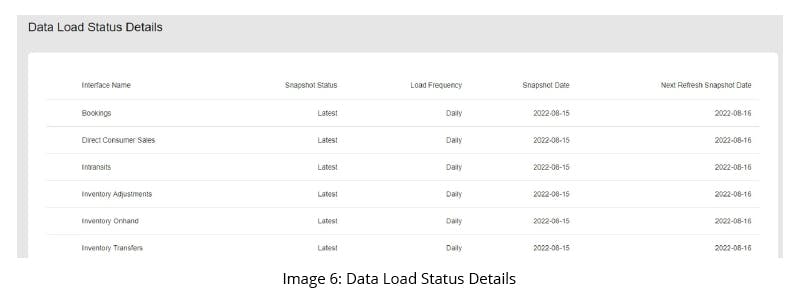
In addition, the business user needs information about data freshness. The dashboard needs to show how fresh the data is - whether it’s the latest data or if it’s ‘X’ days old. Another point of interest is which snapshot data is available and when the data will next refresh.
The dashboard should also provide user-friendly tool tips that state details such as whom to reach out to and in what scenario. Using these insights, business users can feel confident enough to start their planning activities from downstream systems.
Dashboard Visualizations
Dashboard: Data Health
- Persona — Technical Product Manager
- Use Case — The support team validates the data across layers during the month-end activity. A Data Engineer and Technical Product Manager are responsible for addressing volume differences.
- Reporting Solution — Data health month-end analysis dashboard
This reporting solution is built to address multiple personas. The data engineering team ensures the product business teams receive accurate inventory quantities and product data to forecast inventory for the upcoming month.
The support engineering team helps data engineers and SMEs (subject-matter experts) validate and highlight variations across data layers. The support engineers must also ensure reconciling quantity information across all layers.
Dashboard Capabilities
This data health dashboard provides automated data comparison across all data layers. Persona using this dashboard has a tabular view of all data products for a platform by geography or snapshot. It provides quantity comparisons and delineates percentage differences in all data layers.
The dashboard provides drill-down capabilities at the store and sub-category levels. This allows the information consumer to view variations at different levels for further analysis.
Interactive visualizations take the form of both trend and bar charts, and are used to perform root-cause analysis. The visualization also allows product managers to spot data gaps showcasing regional and node-level comparisons quickly.
It accomplishes automated validation via BEAT (GSPANN’s big data ETL automation testing tool) and visualizations through Tableau.
Dashboard Visualizations
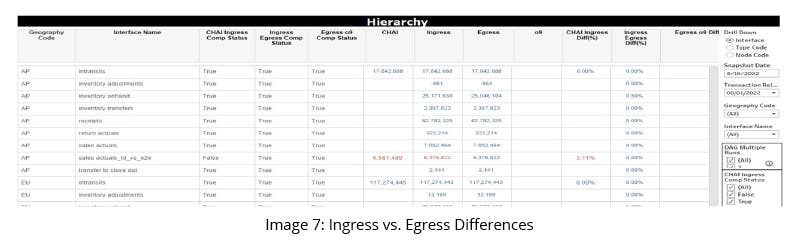
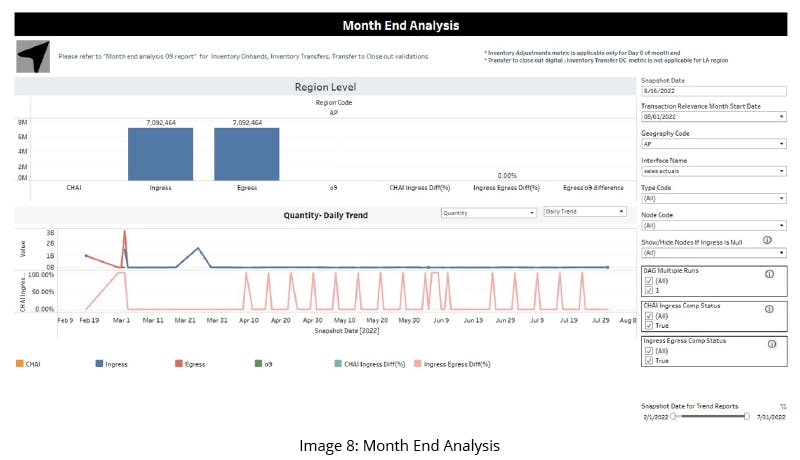
The above visualizations and data require no manual effort to compare inventory quantities. They avoid lengthy walkthroughs and reviews since they only consider the highlighted variations.
Another important point is that the speed of metadata configuration using BEAT requires minimal effort. Turnaround time for adding new capabilities into the month-end analysis dashboard is minimal.
Dashboard: Data Health
- Persona — Data Engineer
- Use Case — Ensures only high-quality data is loaded to o9 and target systems validate freshness, accuracy, and integrity.
- Reporting Solution — Data health dashboard
From the perspective of a data engineer, you need to ensure that the inventory business team, who are consumers of the inventory dataset, receives the highest quality data. That means that no erroneous or corrupted data should flow to its consumers. Data integrity is maintained until all functional and non-functional data validation passes successfully. The primary goal is to have fast identification of data defects.
Dashboard Capabilities
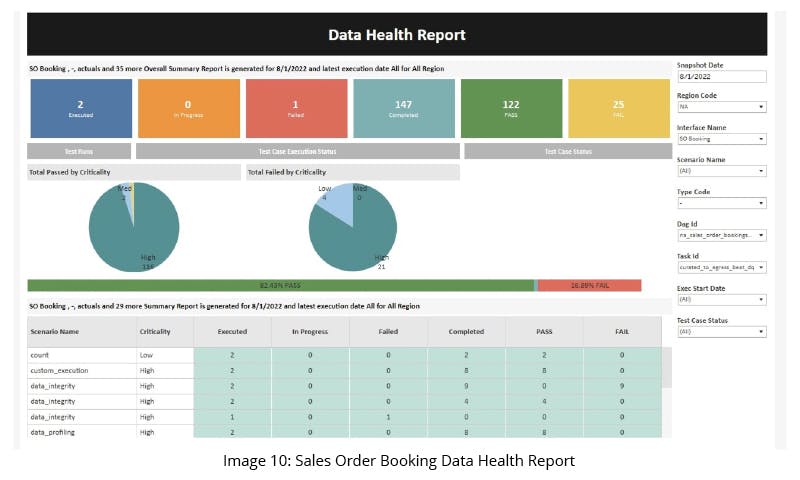
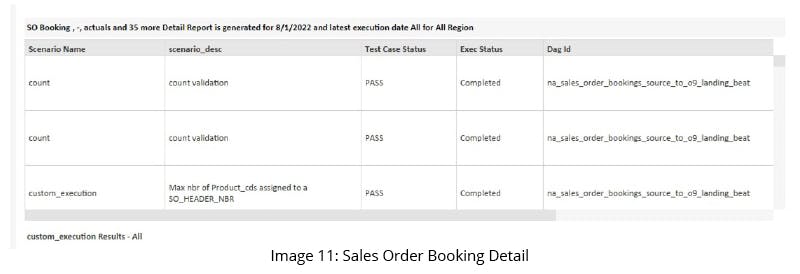
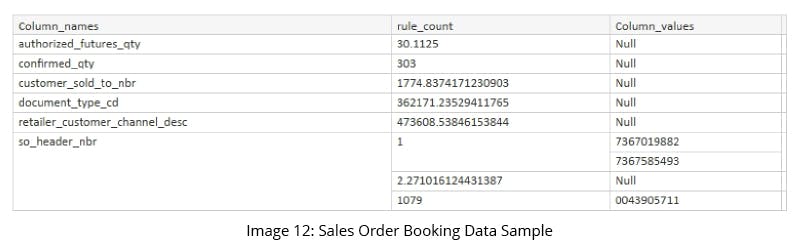
This data health dashboard provides an overview of data quality rules configured for product data. Business users gain visibility on the number of times data validation jobs are executed. They also need to know how many data rules were validated and how many passed or failed. The dashboard also provides drill-down capabilities showcasing sample data received for configured for a specific data rule.
Using these insights, the data engineer can return to the data source and resolve problems before business partners consume the data. The quick resolution allows business teams to make well-informed decisions on a high-quality dataset.
Dashboard Visualizations
Data Sampling:
Dashboard: Data Health Node Analysis
- Persona — Support Engineer
- Use Case — Ensures data for all stores are received and loaded into o9. It identifies and communicates any missing node to stakeholders for data completeness.
- Reporting Solution — Node analysis dashboard
Persona Story
As a support engineer participating in month-end data reconciliation activity, I ensure that my consumer applications receive data for all my stores.
It compares manual Excel-based inventory quantities by store and geographic location across all data layers before presenting the solution. The store inventory in the current month is compared to what was present in the previous month.
Dashboard Capabilities
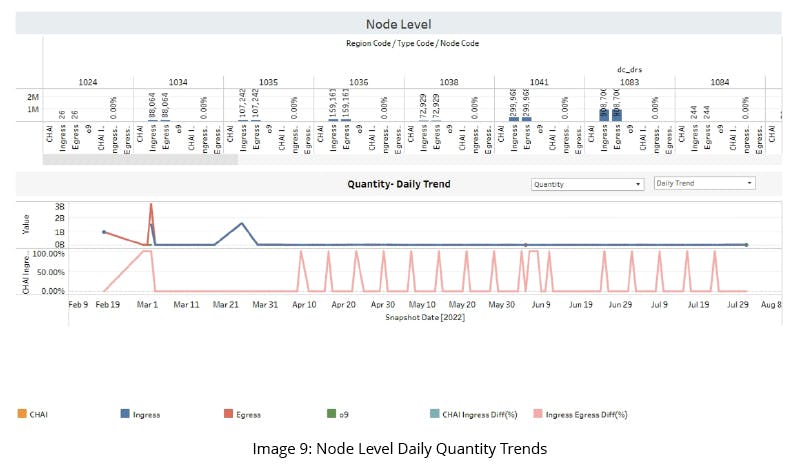
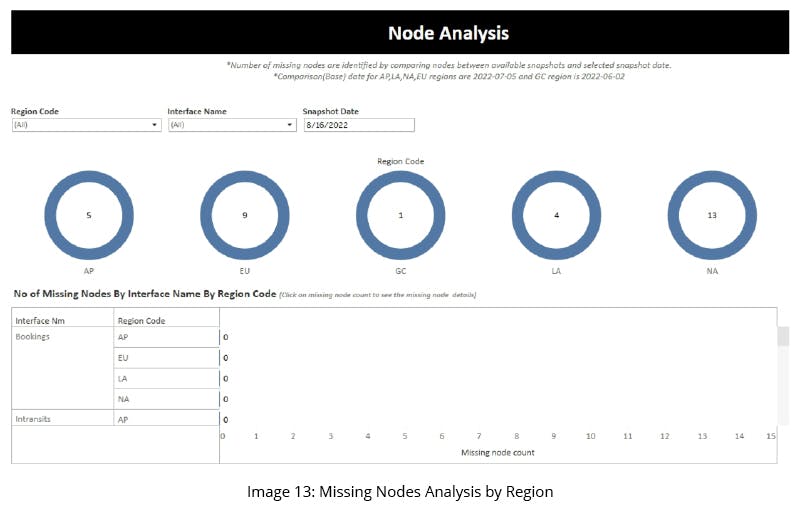
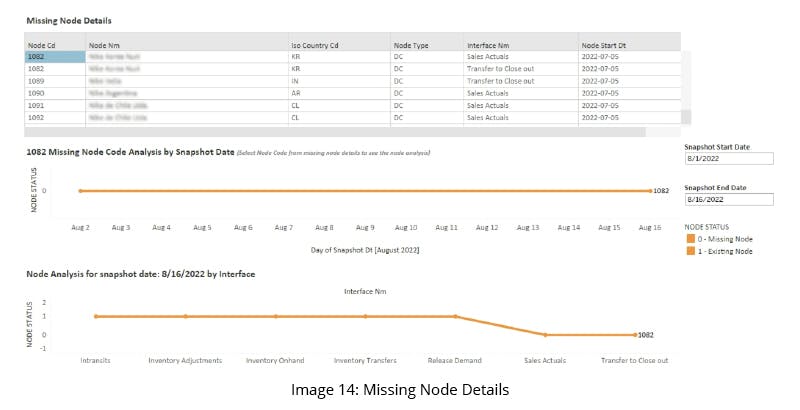
The node analysis dashboard overviews node behavior by region of a data product. Oddly, what might be most important is not what is present but what is not present. The dashboard needs to identify missing nodes clearly.
Another aspect of this dashboard would be interactive visualizations. For example, trend charts show node behavior over time, by metric, and by a snapshot. Also, the overall node analysis dashboard provides faster RCA, quick response time, and saves monitoring time and effort.
Dashboard Visualizations
Dashboard: Subscription-based Alerts
- Persona — Data and Support Engineer, Technical Product Manager, Business User
- Use Case — Immediately notifies if a critical data pipeline job has failed to deter them from planning any activities.
- Reporting Solution — Subscription-based alerts dashboard
This reporting solution applies to multiple personas, such as support engineers, data engineers, technical product managers, and business users. They must take certain actions as soon as any unexpected behavior in the data pipeline job or actual data is noticed.
Business users must be notified if all data pipeline jobs are completed within the business SLA, so they know to start business activities associated with the dataset. Data engineers or support engineers need alerts on job success or failure. Support engineers are in a position to take remedial action in case of a failure.
Having subscription enabled on alerts for users will eliminate multiple communication channels for a confusing array of irrelevant alerts. Also, the manual effort and time required to find a specific alert could unintentionally lead an engineer to miss other relevant alerts.
Dashboard Capabilities
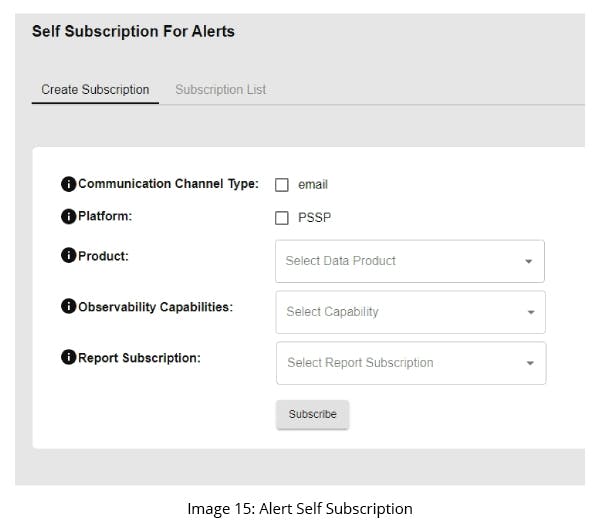
This dashboard provides a self-subscription portal allowing users to subscribe to needful alerts. The subscription should be for a particular platform and its data products. A user can subscribe to events happening regarding both pipeline and data health.
In pipeline health, users can subscribe to alerts on any data pipeline job success or failure. The dashboard also shows if a job has crossed its technically defined SLA.
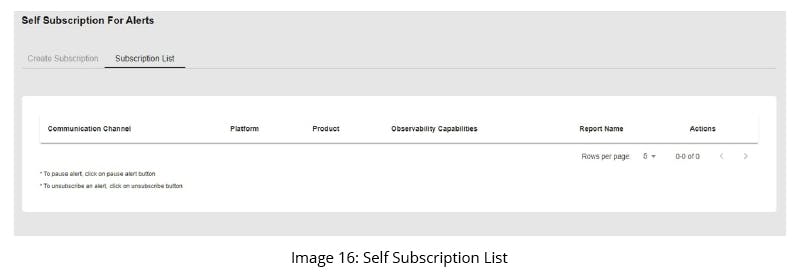
In data health, users can subscribe to the failure of any data quality rules for a data product. The portal also provides the capability to pause or resume a job if the user is out on leave. It also can unsubscribe alerts if the user has moved out of the current team. Hence, a user can subscribe, pause, resume, and unsubscribe alerts with just a few clicks and ticks on checkboxes.
Dashboard Visualizations
Conclusion
To wrap it up, observability pipelines and data health dashboards offer interactive visualizations that provide valuable insights that drive decision-making. The observability landscape is vast, and there are numerous possibilities for building reporting solutions for different persona requirements. Many companies miss the boat when it comes to fine-tuning analytics data. If you first define a set of roles vital to your organization, you can then deploy dashboards appropriate to the persona to gain a clear picture of business health.