Who is the Company

A multinational corporation that develops and markets footwear, apparel, equipment, accessories, and services.

The Challenge

The company has stores located worldwide – some of them directly owned and some managed by third-party affiliates. Each store moves a massive amount of inventory around the globe daily.

They depended on regular information and updates on sales, receipts, adjustments, and in-transit details to make accurate inventory requirement predictions at the store, regional, and geographic levels. But due to a lack of timely and accurate data, they faced challenges in inventory management, including planning sales and product transfers.

Additionally, the company’s current analytics platform was based upon a legacy Teradata implementation, lacked information on digital transactions, and did not cleanly integrate with a cloud environment.


The company needed to consolidate and cleanse the acquired data and send it to an analytics dashboard to make visualizations. Further, the company needed a system to capture end-to-end inventory management and sales data so that information was visible across all stages.

In short, the company needed to:

  • Move quality integrated KPI data to its end-users: Since data is gathered from thousands of stores worldwide, it arrives across the sales regions at different times. Another complication was that the company did not own all their stores. Hence, they needed a solution to integrate all data and provide it to the data consumers while ensuring high quality.
  • Gain end-to-end inventory visibility on a cloud-based infrastructure: The company was looking for an implementation that would provide direct end-to-end access to KPA/KPI data that matched the performance of its current system. Further, they needed help in transitioning to a cloud-based infrastructure.
  • Access to accurate and comprehensive KPI data: The company based its sales predictions and inventory transfer decisions upon incomplete information since the old system did not include digital transactions. Access to a wide range of high-quality KPI data would allow them to make better decisions when fulfilling the inventory needs of their sales regions, affiliates, and stores.

The Solution

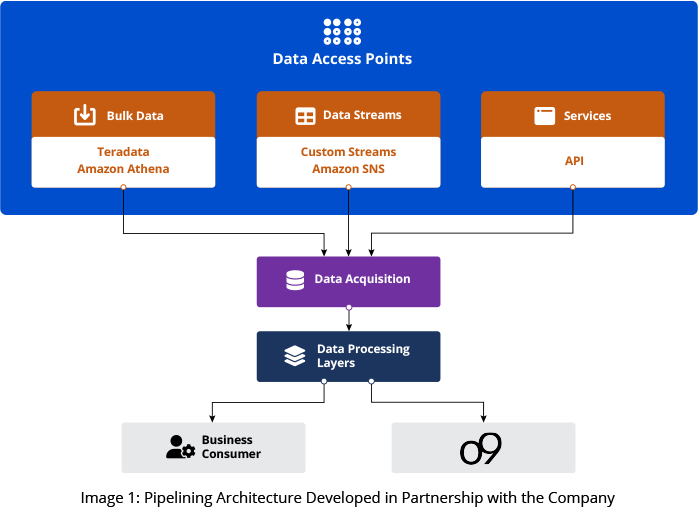
The main goal of our Analytics team was to develop a few additional application layers that integrated purchase order, delivery, and sales order data to produce consolidated inventory transfer and sales information. Technologies used in the development of the application layers included PySpark, Databricks, Snowflake, and Hive.

The team leveraged Microsoft Azure Data Lake Storage (ADLS) and Azure Copy to retain historical information. Historical data allows the company to make more accurate sales and inventory predictions from o9. The Analytics team created a final layer to consolidate data into customizable re-usable tables that allow business users, such as store managers, to conduct day-to-day sales services.

The GSPANN Information Analytics team also incorporated its in-house innovation - BEAT, a data quality framework, which performed data quality checks as data moved from one layer to the next within the data storage and processing infrastructure. The team created dashboards for both technical and business users. Technical users can view details on data flow within the pipeline and completion status. Business users can access information such as inventory order status, including shipped, received, or still in transit.

For more information on BEAT, read this article:

Automating Quality of Data Transformations in the Big Data World.

The solution helps the company gain:

  • Comprehensive end-to-end data access: Previously, business users only had access to physical data such as direct in-store purchases. Business and technical teams have complete data stream transparency with the new system and easily comprehensible dashboards. It includes data like shipping information, purchase orders, sales orders, and online purchases from all stores across all regions, enabling them to make informed inventory and supply chain decisions.
  • A data quality check framework: The implemented quality framework monitors every data stream at each layer, ensuring strict data accuracy.

Business Impact

Key business benefits of the implemented solution include:

  • Increased inventory visibility allows immediate adjustments: The company can now accurately view sales and inventory data as it moves from layer to layer. This enables production engineers to ensure that the correct data is accurately assimilated and moved between the layers. Any data flow problems are now quickly detected and corrected.
  • Comprehensive, integrated data leads to more accurate forecasting: The new end-to-end system gives the company an accurate picture of inventory movement and sales standings. Higher data accuracy leads to better predictions, resulting in higher profit margins and less waste. The inclusion of digital transactions gives the company a more accurate picture than the old system.

Technologies Used

o9 Platform: AI/ML-driven data analytics platform that provides deep insights into data to facilitate forecasting and demand planning
PySpark: Library that allows Python-based applications to access Apache Spark
Databricks: Collaborative data analytics platform that incorporates SQL analytics, machine learning, and support for data lakes
AWS EMR: Big cloud data platform that provides support for Apache Spark and Hive among many others
Snowflake: Cloud data platform that provides an elastic performance engine, intelligent infrastructure, and customized governance controls
Hive: Apache Hive is an open-source data warehouse and analytics library that provides advanced SQL-like query capabilities
BEAT: A highly customizable data quality framework
Azure Data Lake: Cloud-based big data storage platform that also provides analytics tools

Related Capabilities

Utilize Actionable Insights from Multiple Data Hubs to Gain More Customers and Boost Sales

Unlock the power of the data insights buried deep within your diverse systems across the organization. We empower businesses to effectively collect, beautifully visualize, critically analyze, and intelligently interpret data to support organizational goals. Our team ensures good returns on the big data technology investments with the effective use of the latest data and analytics tools.

Do you have a similar project in mind?

Enter your email address to start the conversation