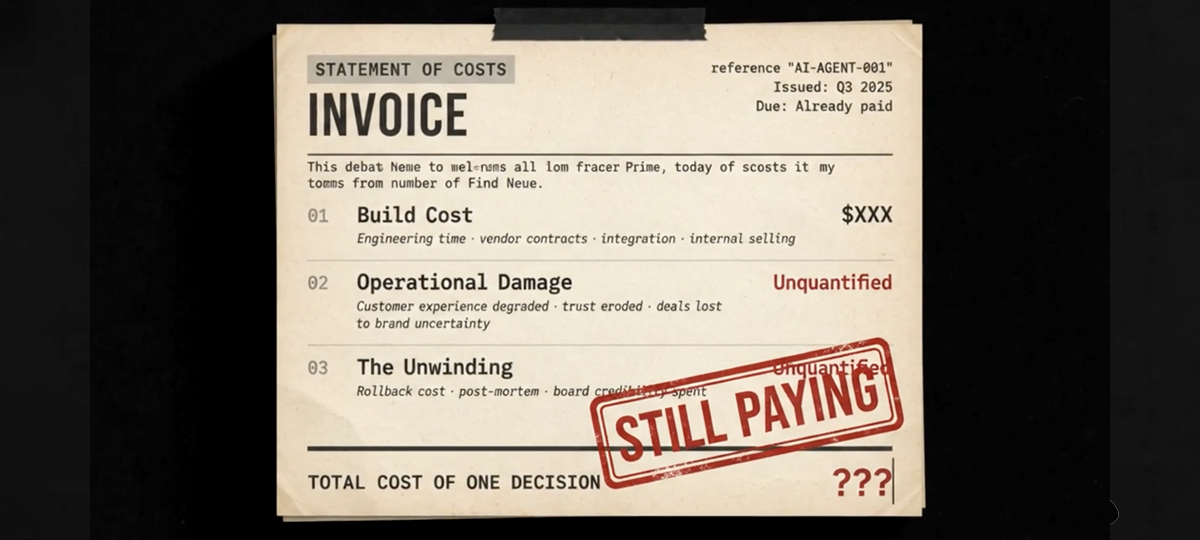

Ask what one finished AI task costs you. Measuring AI ROI starts there, and the only hard numbers in the room come from your vendors.
For 25 years, software cost was easy to total: seats, licences, one invoice. AI spend now arrives through five budgets: cloud bills, SaaS, infrastructure, data, and data centres.
The sixth annual State of FinOps survey found that 98% of practitioners now manage AI costs, up from 31% two years ago.
In two years the remit widened from the cost of cloud to the cost of all technology, and the number nobody can produce is the cost of one finished task.
Cost stopped being a rounding error this year
In McKinsey's latest State of AI survey, 20% of respondents say AI operating costs have limited their use of the technology.
Spend climbed anyway. 80% of organizations reported higher AI spend over the past six months, and 78% expect it to keep rising.
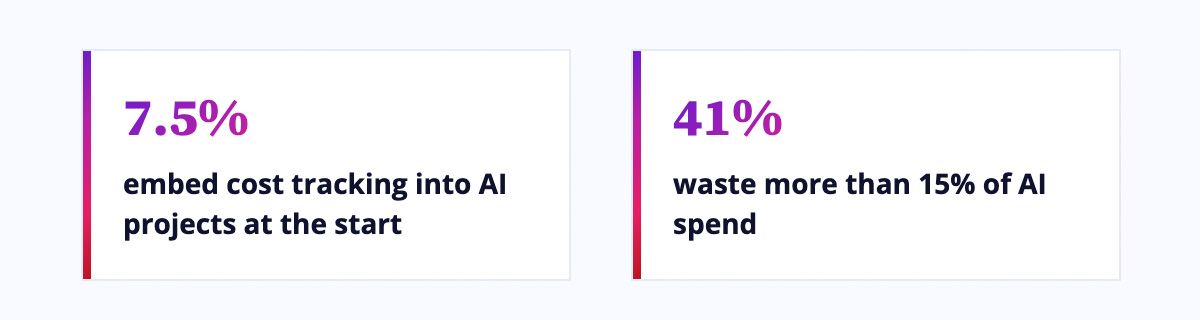
IDC research found that 7.5% of enterprises embed cost tracking into AI projects at the start, and that 41% waste more than 15% of what they spend.
The final AI bill is mostly reconstructed from vendor payments, and no accounts record matches that spend to actual use.[1] [2]
Why can't we show AI ROI when every team says they are more productive?
Because the saving people report and the earnings the accounts record are two different measurements.
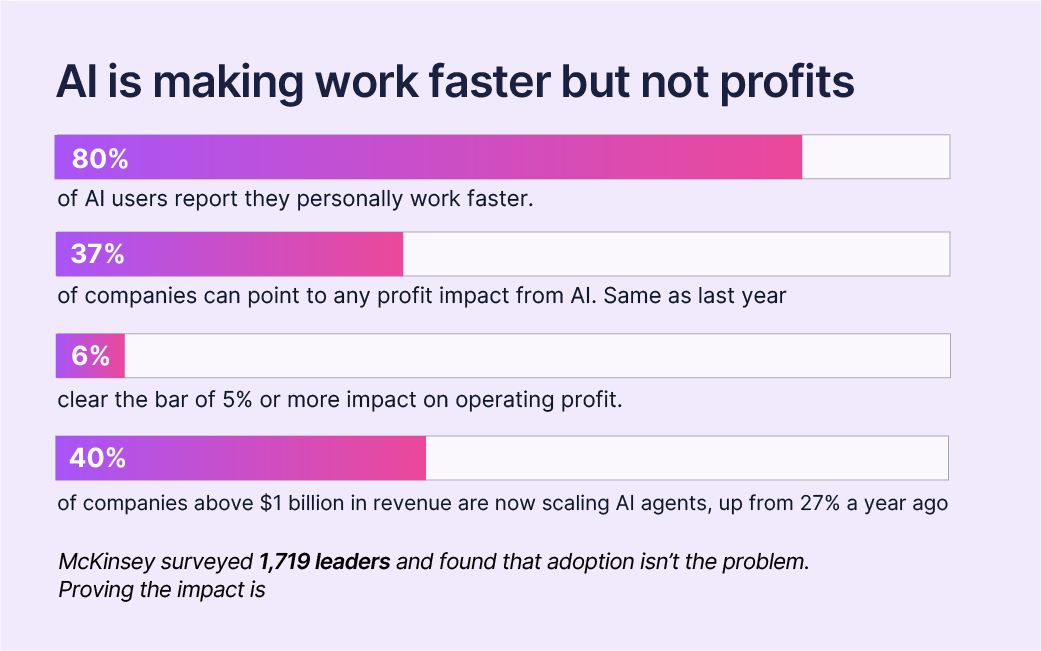
McKinsey surveyed 1,719 leaders. 80% of AI users report personal productivity gains. 37% of organizations can attribute any EBIT impact to AI, unchanged from last year, and 6% clear McKinsey's high-performer bar of 5% or more of EBIT.
Adoption is not the constraint. 40% of companies above $1 billion in revenue are scaling agents, against 27% a year ago. The earnings line stayed flat while that happened. What is left is what people say about their own time.[3] [4]
Self-reported time savings do not survive observation
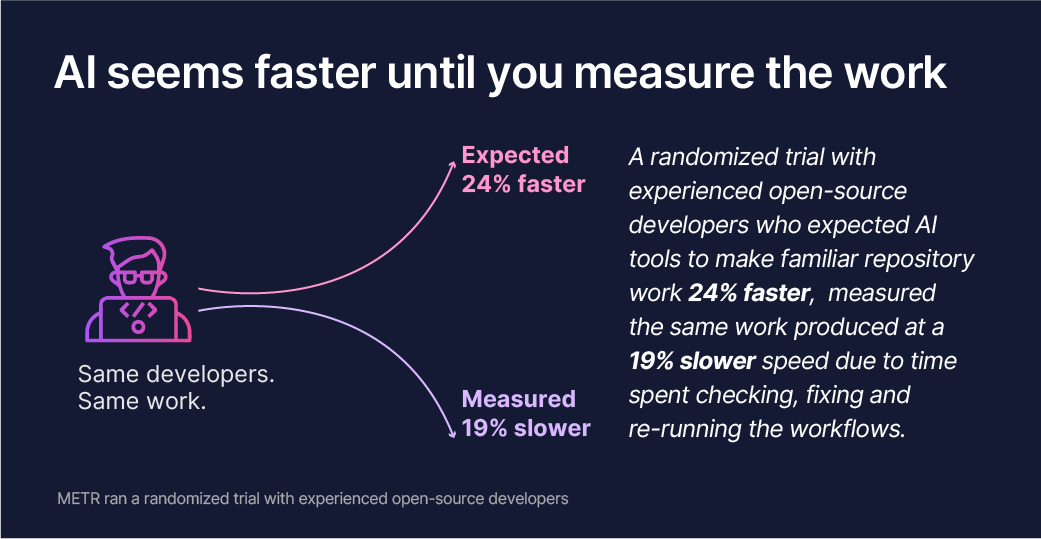
Ask people how much time AI saved them and the number is generous. METR ran a randomized trial with experienced open-source developers who expected early-2025 AI tools to make familiar repository work 24% faster. The measured result was 19% slower on the same work.
Glean's survey of 6,000 digital workers reported 11 hours of claimed weekly saving against 6.4 hours spent on context, output checks, and reruns. The net is 4.6 hours. The 11 is the number that reaches the slide.[5] [6]
Measure cost per successful task
Cost per successful task is the number a finance team can hold.
In July 2026, OpenAI's CFO Sarah Friar published a scorecard built on four questions:
- Is AI completing work that matters?
- What does each successful task cost?
- Can people depend on the result?
- Does each dollar buy more as usage grows?
The method is arithmetic. Count the AI-completed work that clears a defined quality bar, add the fully loaded cost of producing it, and divide. The hard part is defining the unit.[7] [8]
Six fields decide whether a workflow can produce a number at all
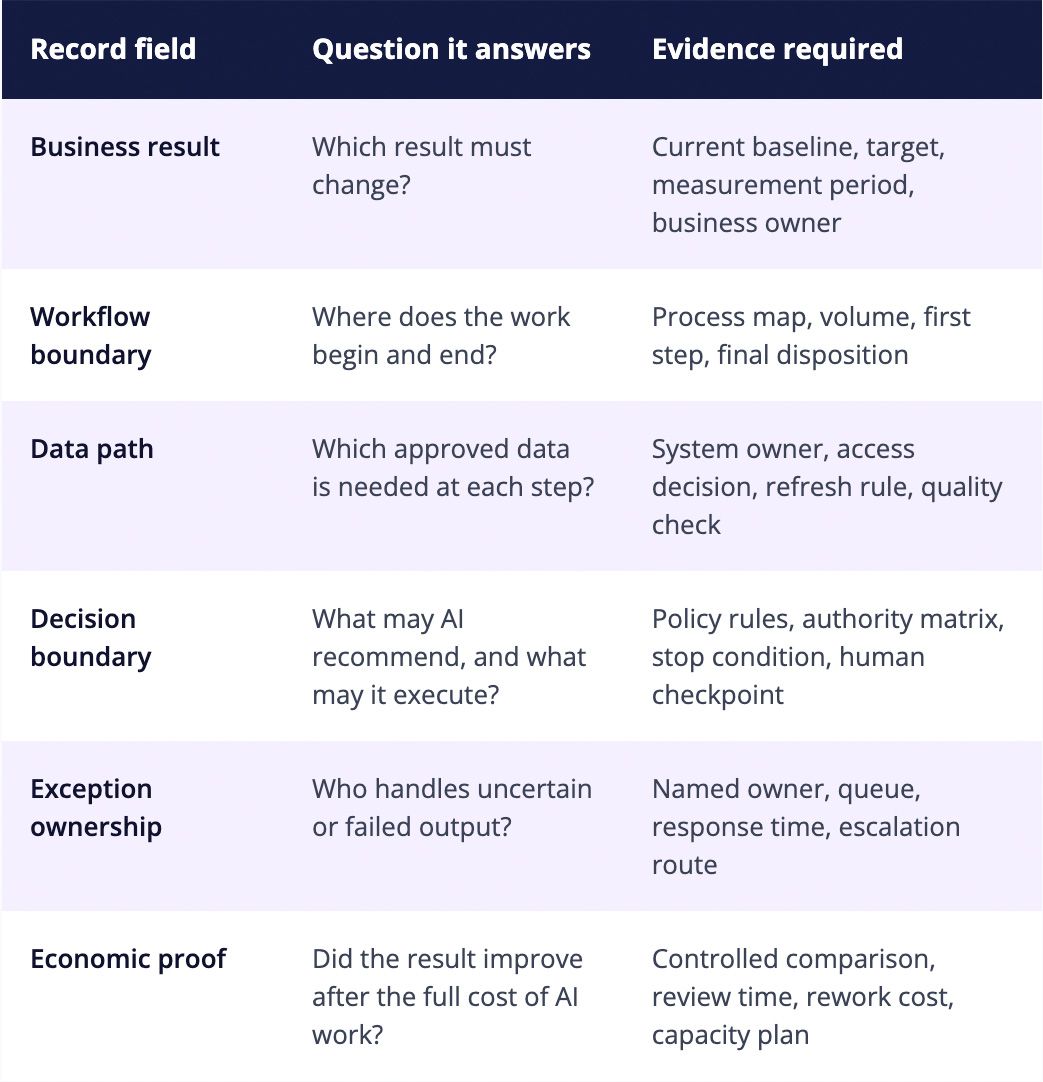
Defining your own unit takes six things. A workflow missing any one of them cannot produce a defensible cost per task.
The workflow readiness record holds them on a single page, each with an owner and evidence, and ends in one of four states: unscoped, blocked, test-ready, or scale-ready. The first five fields exist to make the sixth one calculable. The record is ours; the field definitions map to ISO/IEC 42001, ISO/IEC 42005, and the NIST AI Risk Management Framework.[9] [10] [11]
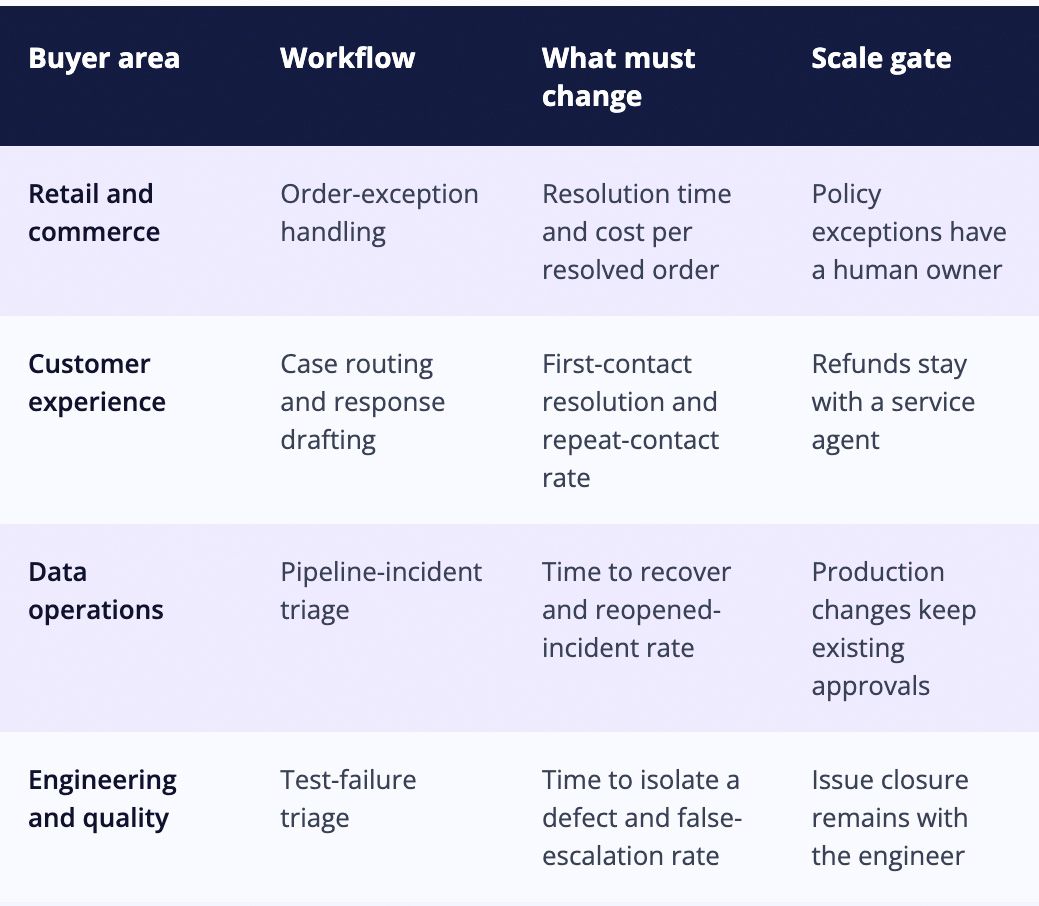
Here is the same record with every row populated for order-exception handling, the workflow most retail and commerce teams can baseline fastest because every input and disposition is already counted somewhere. The work sits in the third column. A field counts as complete only when a named person can produce the artefact behind it.
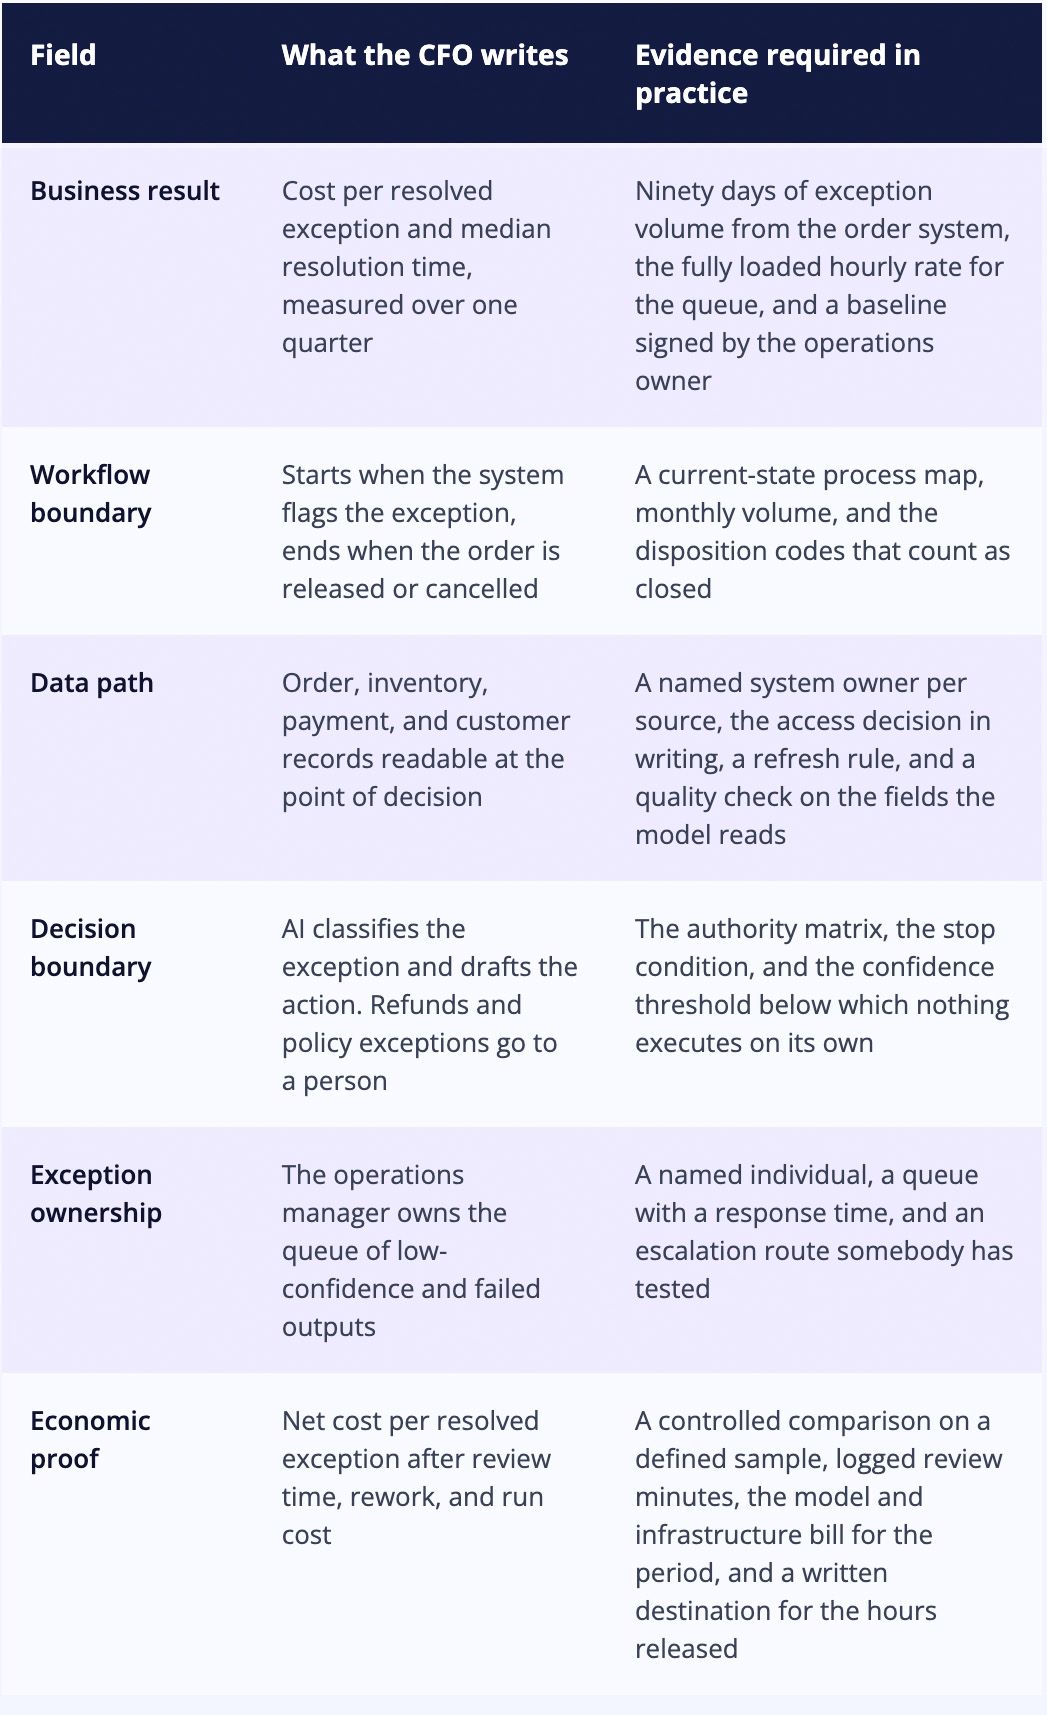
The economic proof row is the only one a CFO signs.
Total cost of an AI workflow, for the maths enthusiasts
Net Saving = R(Hg − Hr) − (Cm + Ci + Cl + Cp)
Where:
- R: fully loaded hourly cost of the person whose time is being saved
- Hg: gross hours removed from the task
- Hr: repair burden, the hours spent checking, correcting, and reworking output
- Cm: model call cost (tokens × unit price × volume)
- Ci: infrastructure (compute, storage, orchestration, retrieval)
- Cl: licences and seats
- Cp: platform meters (per-run, per-action, per-credit charges)
The repair burden is the term most people leave out, and it has its own shape:
Hr = N(vt + f·tf)
- N is the number of outputs.
- vt is the verification time you pay on every one.
- f is the fraction that fails review.
- tf is the rework time per failure.
Verification is unconditional; rework is probabilistic. That distinction matters, because a workflow with a 5% failure rate still charges you vt on 100% of outputs.
Which gives you the break-even condition:
Hr/Hg < 1 − C/(R·Hg) where C = Cm + Ci + Cl + Cp
Cm, Ci, Cl, and Cp rarely belong to one workflow, so each arrives on an invoice shared with others.[12] [13]
How do you split shared AI cost across workflows?
By tagging at the point of call, before the invoice arrives.
A shared model endpoint, a vector store, and a licence pool each serve many workflows at once, which is why the FinOps Foundation now reports AI as its own spend category instead of a line inside cloud. Allocate each one on the unit you already chose: model calls per completed task, storage per record enriched, seat-months per queue.
For anyone serving EU users, the disclosure and content-marking duties that took effect on 2 August 2026 sit on that same run-cost line. Teams that already run an enterprise AI governance programme have most of that evidence on file. The penalty ceiling is 15 million euros or 3% of worldwide turnover, and the size of the line depends on where the workflow runs.[14] [15] [16]
The same workflow costs more outside the United States
The same workflow runs at a different price in each region, and the vendors now print the difference.
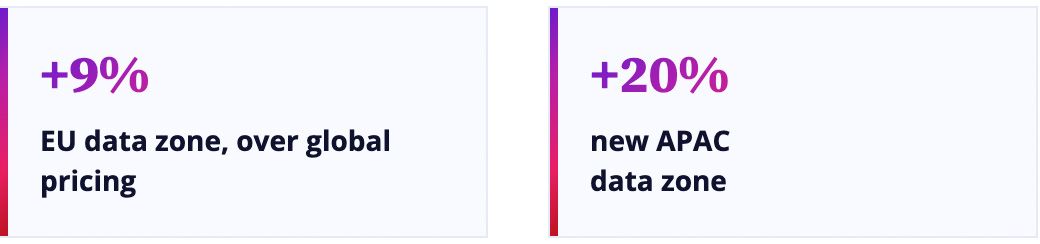
Microsoft's Foundry deployment pricing puts EU data zone deployments 9% above global, other non-US regional deployments 7 to 16% above, and a new APAC data zone at 20% above. Mistral prices regional inference at a 10% premium.
Data residency sets a number in the unit cost. A cost per finished task calculated on US infrastructure will not hold for the same workflow serving Frankfurt or Leeds.[17] [18]
How do you baseline an AI workflow you never measured before?
Pick a workflow whose inputs and outputs can be counted, then spend the time on the charter before anyone touches a tool: the business result, the current cost and time, the measurement period, and the business owner. Expect the charter to take longer than the pilot.
Run the current and AI-assisted versions side by side on a defined sample. Log review time, rework, failed outputs, and the result the workflow exists to change.
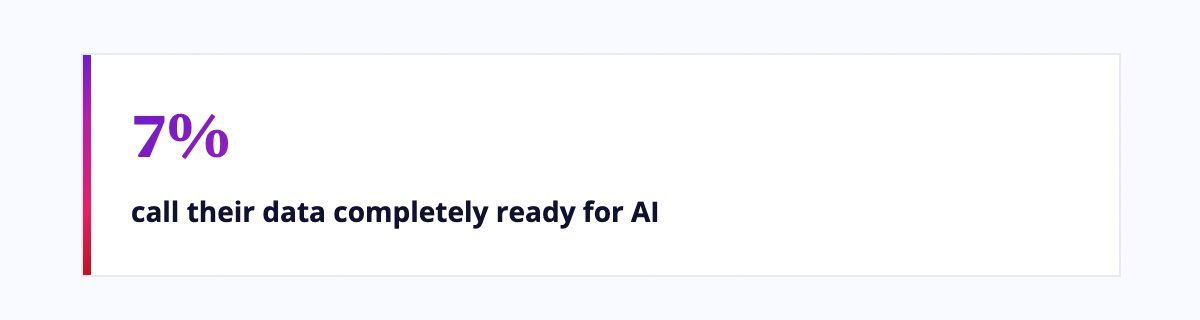
The blocker shows up at the data path. That is a data quality automation problem before it is an AI problem. Cloudera and Harvard Business Review Analytic Services put 7% of enterprises at completely ready data, and 73% at struggling to prepare it. A blocked data path is a bill you pay either way, before any saving is measured.[19] [20]
Procurement is the one place the saving already shows
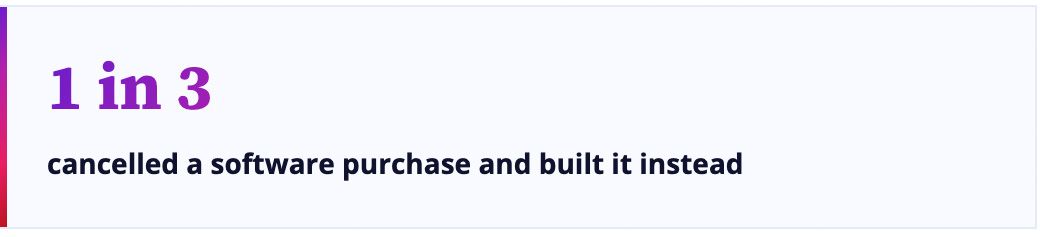
One saving needs no measurement: in the same McKinsey survey, nearly one third of respondents declined a software purchase and built the functionality with agentic coding tools instead. That saving is sitting in the accounts right now.
It is visible for one reason: a vendor quote gave them a figure to beat. Every other AI saving has to be calculated from the old workflow cost.[21]
What should a CFO require before funding AI scale?
- The old workflow cost and business result.
- The pilot results after human checking and rework.
- The run cost across every budget the spend touched.
- The cost of failures and unowned exceptions.
- The destination of the released capacity, with a named owner.
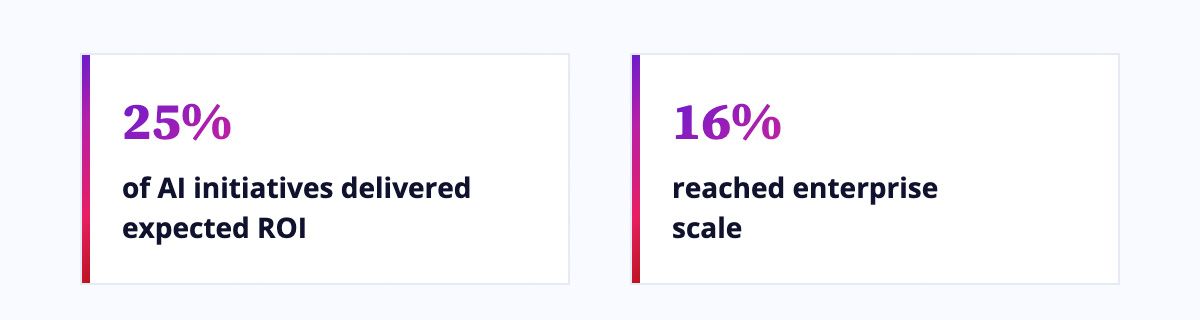
In IBM's CEO study, 25% of AI initiatives delivered the expected ROI and 16% had scaled across the enterprise. PwC surveyed 767 US operations and supply chain leaders: 89% could name a reason their technology investments had not fully delivered, and the small leading cohort was the one measuring operating and financial impact.[22] [23]
Who really owns the AI ROI number?
Four people own four pieces of that financial record, and one business owner stays accountable for the result.
- The CFO owns baseline cost, full pilot cost, rework, failure cost, and where released capacity goes.
- The CIO owns the approved architecture, access path, integration load, and production support. Run cost is set there, before anyone can measure it.
- The COO owns the workflow boundary, service level, and exception queue.
- The Chief Data Officer owns lawful access, quality checks, and lineage, without which the data path stays blocked and the number never arrives.
The arithmetic is the part nobody can delegate.[24] [25]
GSPANN'S TAKE
The industry sold AI as a productivity story, because productivity is easy to demonstrate and difficult to audit.
- Saved hours are not savings. Net saving is gross time saved, minus repair, minus run cost, with a named destination for the capacity that comes free.
- The unit of account is the decision. Define one completed unit of business work and cost it fully, or inherit a meter built to count what you consumed.
- The bill includes the checking. Verification is charged on every output, rework only on the ones that fail, and a 5% failure rate still buys a check on 100%.
- The same workflow has more than one price. A number calculated on US infrastructure does not survive the move to Frankfurt or Leeds, and the EU disclosure duties sit on the same line.
The first programme a CFO cuts is the one that cannot show its arithmetic. The only question is what one finished task costs now against what it cost before. Own that number before someone asks you for it.
All References:
Ref 2: https://www.ciodive.com/news/ai-spend-management-cios-finops/817620/
Ref 3: https://www.mckinsey.com/capabilities/quantumblack/our-insights/the-state-of-ai
Ref 5: https://metr.org/blog/2025-07-10-early-2025-ai-experienced-os-dev-study/
Ref 6: https://www.glean.com/work-ai-institute/reports/work-ai-index
Ref 7: https://openai.com/index/a-scorecard-for-the-ai-age/
Ref 8: https://www.cfodive.com/news/openai-pushes-new-roi-yardstick-ai-cfos/825606/
Ref 9: https://www.iso.org/standard/42001
Ref 10: https://www.iso.org/standard/42005
Ref 11: https://nvlpubs.nist.gov/nistpubs/ai/NIST.AI.100-1.pdf
Ref 12: https://www.glean.com/work-ai-institute/reports/work-ai-index
Ref 13: https://data.finops.org/
Ref 14: https://data.finops.org/
Ref 15: https://digital-strategy.ec.europa.eu/en/policies/guidelines-ai-transparency-obligations
Ref 18: https://mlq.ai/news/mistral-prices-regional-inference-at-10-premium-and-priority-tier-at-75/
Ref 20: https://mitsloan.mit.edu/ideas-made-to-matter/how-ai-reshaping-workflows-and-redefining-jobs
Ref 24: https://www.deloitte.com/us/en/industries/government-public/about/enterprise-ai-for-government.html
Ref 25: https://www.publicissapient.com/company/news/ai-adoption-enterprise-readiness-report-2026