<p>Database monitoring is different from infrastructure and application monitoring. It involves monitoring database performance, slow running queries, uptime, etc. It is essential because if a database goes down, it may bring the whole application to a standstill.</p>
<p>Various tools help in monitoring database, like Grafana, Kibana, netstat, etc. While Kibana only collects log metrics data, netstat is apt to displace connections and routing tables. Grafana labs give more performance visibility in comparison to others. It is an open-source metric analytics and visualization tool that enables developers to write plugins from scratch to integrate with several data sources.</p>
<p>Even if there is a failure, we can easily troubleshoot the issue with the available stats, like database connections, number of containers running and performance, number of bytes written and read, etc. This blog throws light on how to monitor a MySQL database using Grafana and Prometheus.</p>
<p><a target="new" href="https://www.gspann.com/resources/blogs/sql-vs-nosql-database">Click here for a thorough comparative analysis between SQL and NoSQL databases.</a></p>
<h3 style="text-align: left;">Steps to Enable MySQL Database Monitoring Using Prometheus and Grafana</h3>
<ol>
<li>Install and configure Grafana</li>
<li>Install and configure Prometheus</li>
<li>Install a database exporter</li>
<li>Install the database</li>
</ol>
<p><strong>1. Install and Configure Grafana</strong></p>
<p>Grafana helps in studying data, analytics, and monitoring over a period of time. It is also known as time-series analysis.</p>
<p><u>Installation steps:</u></p>
<p><Strong>Step 1:</Strong> Go to Grafana’s official page and download Grafana for the respective operating system.</p>
<p>Execute:</p>
<div class="col-md-10">
<code>
<pre style="padding: 0px 20px; margin: 0px; font-size: 15px; text-align: left; border:1px solid #B5B5B5; background-color: #F4F4F4;">
wget https://dl.grafana.com/oss/release/grafana_6.5.1_amd64.deb
sudo dpkg -i grafana_6.5.1_amd64.deb
</pre>
</code>
</div><br>
<p><strong>Step 2:</strong> Start the server</p>
<p>Execute:</p>
<div class="col-md-10">
<code>
<pre style="padding: 0px 20px; margin: 0px; font-size: 15px; text-align: left; border:1px solid #B5B5B5; background-color: #F4F4F4;">
sudo service grafana-server start
systemctl daemon-reload
systemctl start grafana-server
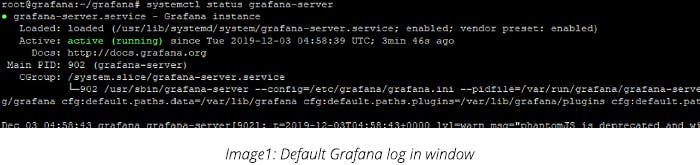
systemctl status grafana-server
</pre>
</code>
</div><br>
<p>This will start the Grafana server process with the Grafana user, which was created at the time of installation. The default HTTP port is 3000 (http://localhost:3000) and the default user and group are admin.</p>
<p>Default login and password of Grafana are: admin/admin</p>
<p>Default location Grafana will log into: /var/log/Grafana</p>
<p><img style="padding: 0px 20px;" width="700px" height="auto" alt="Default Grafana log in window" src="https://images.prismic.io/gspann/c0ea2b85-089e-4b3d-82d5-fb7530079e0f_Image1_+Default+Grafana+log+in+window.jpg?auto=compress,format" /></p>
<p>
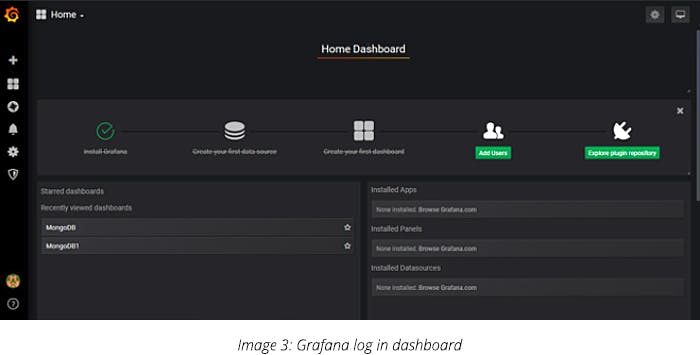
Finally, when you hit the ip_address in the browser, the homepage will be shown as below:</p>
<p><img style="padding: 0px 20px;" width="700px" height="auto" alt="Grafana homepage window" src="https://images.prismic.io/gspann/8ed3e2ce-06cf-4a6a-831e-01e5be3e92e6_Image+2_+Grafana+homepage+window.jpg?auto=compress,format" /></p>
<p>Enter your credentials in the login page, you will see the screen shown below:</p>
<p><img style="padding: 0px 20px;" width="700px" height="auto" alt="Grafana log in dashboard" src="https://images.prismic.io/gspann/fce40045-8804-45de-b4a8-6d1cc5460056_Image+3_+Grafana+log+in+dashboard.jpg?auto=compress,format" /></p>
<p><strong>2. Install and configure Prometheus</strong></p>
<p><strong>Step 1:</strong> Go to the official page of Prometheus and copy the link address.</p>
<p>Using wget command, you can install the Prometheus and untar it.</p>
<p>Execute:</p>
<div class="col-md-10">
<code>
<pre style="padding: 0px 20px; margin: 0px; font-size: 15px; text-align: left; border:1px solid #B5B5B5; background-color: #F4F4F4;">
Wget
https://github.com/prometheus/prometheus/releases/download/v2.3.2/prometheus-2.3.2.linux-amd64.tar.gz
tar -xvf prometheus-2.3.2.linux-amd64.tar.gz
mv prometheus-2.3.2.linux-amd64 prometheus-files
</pre>
</code>
</div><br>
<p><strong>Step 2:</strong> Create a Prometheus user, required directories, and make the Prometheus user the owner of those directories.</p>
<p>Execute:</p>
<div class="col-md-10">
<code>
<pre style="padding: 0px 20px; margin: 0px; font-size: 15px; text-align: left; border:1px solid #B5B5B5; background-color: #F4F4F4;">
sudo useradd /bin/false prometheus
sudo mkdir /etc/prometheus
sudo mkdir /var/lib/prometheus
sudo chown prometheus:prometheus /etc/prometheus
sudo chown prometheus:prometheus /var/lib/prometheus
</pre>
</code>
</div><br>
<p><strong>Step 3:</strong> Copy Prometheus and promtool from the Prometheus-files folder to - /usr/local/bin and, after that, change the ownership to the Prometheus user.</p>
<p>Execute:</p>
<div class="col-md-10">
<code>
<pre style="padding: 0px 20px; margin: 0px; font-size: 15px; text-align: left; border:1px solid #B5B5B5; background-color: #F4F4F4;">
sudo cp prometheus-files/prometheus /usr/local/bin/
sudo cp prometheus-files/promtool /usr/local/bin/
sudo chown prometheus:prometheus /usr/local/bin/prometheus
sudo chown prometheus:prometheus /usr/local/bin/promtool
</pre>
</code>
</div><br>
<p><strong>Step 4:</strong> Move the consoles and console library directories from Prometheus-files to /etc/Prometheus folder and change the ownership to the Prometheus user.</p>
<p>Execute:</p>
<div class="col-md-10">
<code>
<pre style="padding: 0px 20px; margin: 0px; font-size: 15px; text-align: left; border:1px solid #B5B5B5; background-color: #F4F4F4;">
sudo cp -r prometheus-files/consoles /etc/prometheus
sudo cp -r prometheus-files/console_libraries /etc/prometheus
sudo chown -R prometheus:prometheus /etc/prometheus/consoles
sudo chown -R prometheus:prometheus /etc/prometheus/console_libraries
</pre>
</code>
</div><br>
<p><strong>Step 5:</strong> Create the Prometheus.yml file</p>
<p>Execute:</p>
<div class="col-md-10">
<code>
<pre style="padding: 0px 20px; margin: 0px; font-size: 15px; text-align: left; border:1px solid #B5B5B5; background-color: #F4F4F4;">
vi /etc/prometheus/prometheus.yml
</pre>
</code>
</div><br>
<p><strong>Note:</strong> All Prometheus configurations should be present in /etc/Prometheus/Prometheus.yml file.</p>
<p><strong>Step 6:</strong> Copy the following content into Prometheus.yml:</p>
<div class="col-md-10">
<code>
<pre style="padding: 0px 20px; margin: 0px; font-size: 15px; text-align: left; border:1px solid #B5B5B5; background-color: #F4F4F4;">
global
scrape_interval: 10s
scrape_configs:
- job_name: 'prometheus'
scrape_interval: 5s
static_configs:
- targets: [<mention ip_address>:9090']
</pre>
</code>
</div><br>
<p>- follow the intendations in yml file, otherwise it raises an error.</p>
<p><strong>Step 7:</strong> Change the ownership file to the Prometheus user</p>
<p>Execute:</p>
<div class="col-md-10">
<code>
<pre style="padding: 0px 20px; margin: 0px; font-size: 15px; text-align: left; border:1px solid #B5B5B5; background-color: #F4F4F4;">
sudo chown prometheus:prometheus /etc/prometheus/prometheus.yml
</pre>
</code>
</div><br>
<p><strong>Step 8:</strong> Create a service file in this location - /etc/systmed/system</p>
<p>Execute:</p>
<div class="col-md-10">
<code>
<pre style="padding: 0px 20px; margin: 0px; font-size: 15px; text-align: left; border:1px solid #B5B5B5; background-color: #F4F4F4;">
sudo vi /etc/systmed/system/Prometheus.service
</pre>
</code>
</div><br>
<p><strong>Step 9:</strong> Copy the following content to the file:</p>
<p>[Unit]</p>
<div class="col-md-10">
<code>
<pre style="padding: 0px 20px; margin: 0px; font-size: 15px; text-align: left; border:1px solid #B5B5B5; background-color: #F4F4F4;">
Description=Prometheus
Wants=network-online.target
After=network-online.target
</pre>
</code>
</div><br>
<p>[Service]</p>
<div class="col-md-10">
<code>
<pre style="padding: 0px 20px; margin: 0px; font-size: 15px; text-align: left; border:1px solid #B5B5B5; background-color: #F4F4F4;">
User=prometheus
Group=prometheus
Type=simple
ExecStart=/usr/local/bin/prometheus \
--config.file /etc/prometheus/prometheus.yml \
--storage.tsdb.path /var/lib/prometheus/ \
--web.console.templates=/etc/prometheus/consoles \
--web.console.libraries=/etc/prometheus/console_libraries
</pre>
</code>
</div><br>
<p>[Install]</p>
<div class="col-md-10">
<code>
<pre style="padding: 0px 20px; margin: 0px; font-size: 15px; text-align: left; border:1px solid #B5B5B5; background-color: #F4F4F4;">
WantedBy=multi-user.target
</pre>
</code>
</div><br>
<p><strong>Step 10:</strong> Reload the systemd service and start the Prometheus service</p>
<p>Execute:</p>
<div class="col-md-10">
<code>
<pre style="padding: 0px 20px; margin: 0px; font-size: 15px; text-align: left; border:1px solid #B5B5B5; background-color: #F4F4F4;">
sudo systemctl daemon-reload
sudo systemctl start Prometheus
</pre>
</code>
</div><br>
<p>To check the Prometheus status, run the command mentioned below</p>
<p>Execute:</p>
<div class="col-md-10">
<code>
<pre style="padding: 0px 20px; margin: 0px; font-size: 15px; text-align: left; border:1px solid #B5B5B5; background-color: #F4F4F4;">
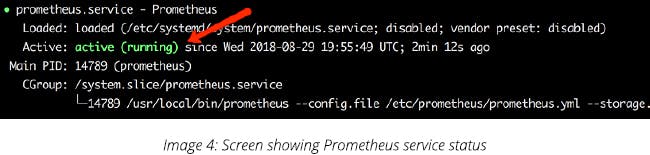
sudo systemctl status Prometheus
</pre>
</code>
</div><br>
<p>The output should be shown as below:</p>
<p><img style="padding: 0px 20px;" width="650px" height="auto" alt="Screen showing Prometheus service status" src="https://images.prismic.io/gspann/933e90b7-c284-4ff1-bc39-ae1ffc1a3426_Image+4_+Screen+showing+Prometheus+service+status_.jpg?auto=compress,format" /></p>
<p>
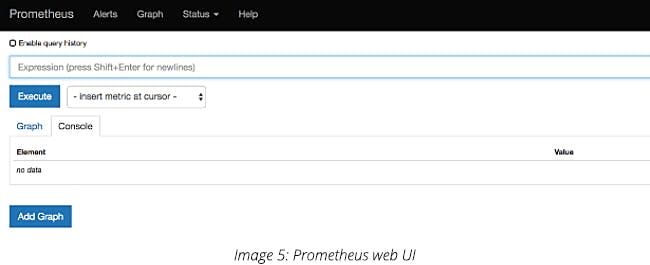
To Access the Prometheus web UI, use the default port 9090.</p>
<p>http://< prometheus-ip >:9090/graph</p>
<p><img style="padding: 0px 20px;" width="650px" height="auto" alt="Prometheus web UI" src="https://images.prismic.io/gspann/d5e04ced-925f-4097-b3a7-7eba6e953865_Image+5_+Prometheus+web+UI.jpg?auto=compress,format" /></p>
<p><strong>3. Installing MySQL</strong></p>
<p><strong>Step 1:</strong> Install the latest version of MySQL</p>
<p>Execute:</p>
<div class="col-md-10">
<code>
<pre style="padding: 0px 20px; margin: 0px; font-size: 15px; text-align: left; border:1px solid #B5B5B5; background-color: #F4F4F4;">
wget https://dev.mysql.com/get/mysql57-community-release-el7-9.noarch.rpm
sudo rpm -ivh mysql57-community-release-el7-9.noarch.rpm
sudo yum install mysql-server
</pre>
</code>
</div><br>
<p><strong>Step 2:</strong> Start the daemon and enable it</p>
<p>Execute:</p>
<div class="col-md-10">
<code>
<pre style="padding: 0px 20px; margin: 0px; font-size: 15px; text-align: left; border:1px solid #B5B5B5; background-color: #F4F4F4;">
sudo systemctl start mysqld
sudo systemctl status mysqld
</pre>
</code>
</div><br>
<p><strong>Step 3:</strong> While installing it for the first time, we need to set a new password</p>
<p>Execute:</p>
<div class="col-md-10">
<code>
<pre style="padding: 0px 20px; margin: 0px; font-size: 15px; text-align: left; border:1px solid #B5B5B5; background-color: #F4F4F4;">
sudo grep 'temporary password' /var/log/mysqld.log
</pre>
</code>
</div><br>
<p>Output: 2019-12-11T09:28:50.095207Z 1 [Note] A temporary password is generated for root@localhost: pdpxle;Nt9*c</p>
<p>The last 12 digits make a password. After executing the command below, you will be prompted to set a new password. The password should be a combination of alphabets in lowercase, upper case, numbers, and a special character.</p>
<p>Execute:</p>
<div class="col-md-10">
<code>
<pre style="padding: 0px 20px; margin: 0px; font-size: 15px; text-align: left; border:1px solid #B5B5B5; background-color: #F4F4F4;">
sudo mysql_secure_installation
</pre>
</code>
</div><br>
<p>Output: If the existing password for the user account root has expired. Please set a new password.</p>
<p>New password:</p>
<p>The Estimated length of the password: 100</p>
<p>Change the password for root? (Press y|Y for Yes, any other key for No) :</p>
<p>Press 'yes' all the times as many times as prompted. It is for security and old data clean-up.</p>
<p>For Testing Mysql connection run the below command:</p>
<div class="col-md-10">
<code>
<pre style="padding: 0px 20px; margin: 0px; font-size: 15px; text-align: left; border:1px solid #B5B5B5; background-color: #F4F4F4;">
mysqladmin -u root -p version
</pre>
</code>
</div><br>
<p>When prompted, enter the new password to log in.</p>
<p><strong>4. Installing the Mysqld exporter</strong></p>
<p><strong>Step 1:</strong> Download the latest version of mysqld_exporter</p>
<p>Execute:</p>
<div class="col-md-10">
<code>
<pre style="padding: 0px 20px; margin: 0px; font-size: 15px; text-align: left; border:1px solid #B5B5B5; background-color: #F4F4F4;">
mkdir mysqld-exporter
cd mysqld-exporter
wget https://github.com/prometheus/mysqld_exporter/releases/download/v0.11.0/mysqld_exporter-0.11.0.linux-amd64.tar.gz
</pre>
</code>
</div><br>
<p><strong>Step 2:</strong> Extract the downloaded archive in your current folder</p>
<p>Execute:</p>
<div class="col-md-10">
<code>
<pre style="padding: 0px 20px; margin: 0px; font-size: 15px; text-align: left; border:1px solid #B5B5B5; background-color: #F4F4F4;">
tar xvzf mysqld_exporter-0.11.0.linux-amd64.tar.gz
</pre>
</code>
</div><br>
<p><strong>Step 3:</strong> Create a user for Prometheus</p>
<p>Execute:</p>
<div class="col-md-10">
<code>
<pre style="padding: 0px 20px; margin: 0px; font-size: 15px; text-align: left; border:1px solid #B5B5B5; background-color: #F4F4F4;">
cd mysqld_exporter-0.11.0.linux-amd64/
sudo mv mysqld_exporter /usr/local/bin/
sudo useradd -rs /bin/false prometheus
sudo vi /lib/systemd/system/mysql_exporter.service
</pre>
</code>
</div><br>
<p>[Unit]</p>
<div class="col-md-10">
<code>
<pre style="padding: 0px 20px; margin: 0px; font-size: 15px; text-align: left; border:1px solid #B5B5B5; background-color: #F4F4F4;">
Description=MySQL Exporter
User=prometheus
</pre>
</code>
</div><br>
<p>[Service]</p>
<div class="col-md-10">
<code>
<pre style="padding: 0px 20px; margin: 0px; font-size: 15px; text-align: left; border:1px solid #B5B5B5; background-color: #F4F4F4;">
Type=simple
Restart=always
ExecStart=/usr/local/bin/mysqld_exporter \
--config.my-cnf /etc/.exporter.cnf \
--collect.auto_increment.columns \
--collect.binlog_size \
--collect.engine_innodb_status \
--collect.engine_tokudb_status \
--collect.global_status \
--web.listen-address=0.0.0.0:9104
</pre>
</code>
</div><br>
<p>[Install]</p>
<div class="col-md-10">
<code>
<pre style="padding: 0px 20px; margin: 0px; font-size: 15px; text-align: left; border:1px solid #B5B5B5; background-color: #F4F4F4;">
WantedBy=multi-user.target
sudo systemctl daemon-reload
systemctl status mysql_exporter
</pre>
</code>
</div><br>
<p>Output:</p>
<p><img style="padding: 0px 20px;" width="750px" height="auto" alt="MySQL Exporter status screen" src="https://images.prismic.io/gspann/d3cca8c7-604b-4271-97e9-6101af042d51_Image+6_+MySQL+Exporter+status+screen.jpg?auto=compress,format" /></p>
<p>
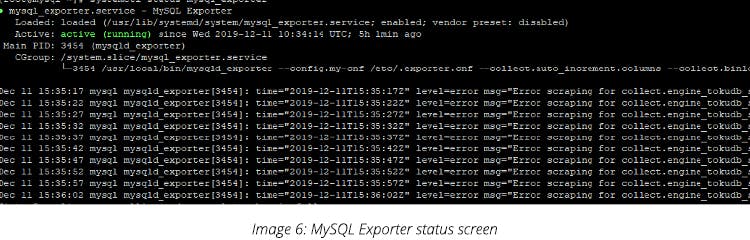
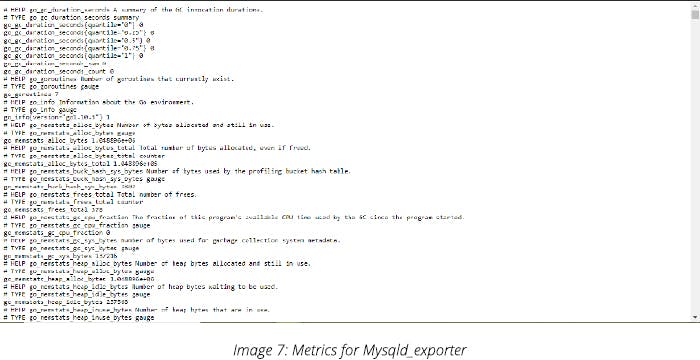
Default port is 9104 metrics for mysqld_exporter(http://< ip_address >:9104)</p>
<p><img style="padding: 0px 20px;" width="700px" height="auto" alt="Metrics for Mysqld_exporter" src="https://images.prismic.io/gspann/16e727a0-89a7-4471-b3a9-44caaa349386_Image+7_+Metrics+for+Mysqld_exporter.jpg?auto=compress,format" /></p>
<p>
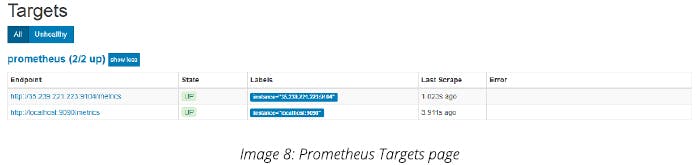
Add it to Prometheus target.
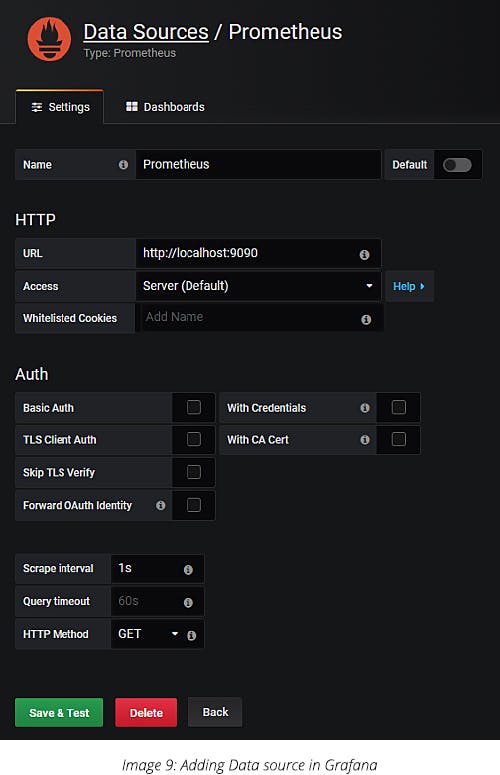
</p>
<p><img style="padding: 0px 20px;" width="700px" height="auto" alt="Prometheus Targets page" src="https://images.prismic.io/gspann/8410cff2-aea6-4eff-83fc-546de082918e_Image+8_+Prometheus+Targets+page.jpg?auto=compress,format" /></p>
<p><strong>Step 4:</strong> Set Prometheus as Grafana data source. Add the data source and name it Prometheus. Enter the URL and click on Save & Test.</p>
<p><img style="padding: 0px 20px;" width="500px" height="auto" alt="Adding Data source in Grafana" src="https://images.prismic.io/gspann/945211e4-76e9-4be5-9408-3ceabbdd8de0_Image+9_+Adding+Data+source+in+Grafana.jpg?auto=compress,format" /></p>
<p><strong>Step 5:</strong> Download the dashboards for Grafana</p>
<p>Execute:</p>
<div class="col-md-10">
<code>
<pre style="padding: 0px 20px; margin: 0px; font-size: 15px; text-align: left; border:1px solid #B5B5B5; background-color: #F4F4F4;">
Cd /etc/Grafana
Sudo mkdir dashboards
Cd dashboards
Sudo wget https://github.com/percona/grafanadashboards/blob/master/dashboards/MySQL_Overview.json
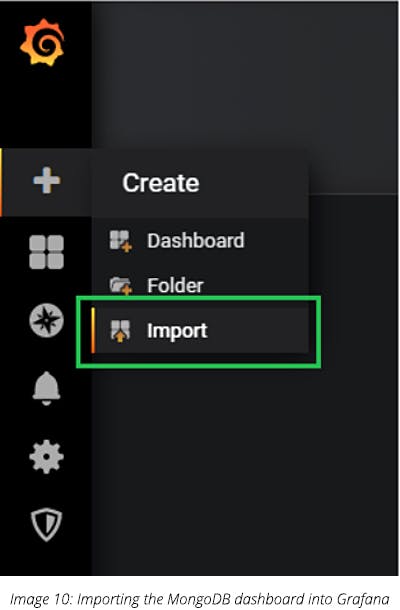
</pre>
</code>
</div><br>
<p><strong>Step 6:</strong> Import the MySql dashboard into Grafana</p>
<p>Go to Grafana dashboard. Run this Url in browser: http://< ip_address >:3000</p>
<p>On the left menu, click on the plus icon and click on import. Then, click on ‘Upload JSON file’ and go to the directory where the JSON file has been downloaded. Choose it to complete the upload.</p>
<p><img style="padding: 0px 20px;" width="400px" height="auto" alt="Importing the MongoDB dashboard into Grafana" src="https://images.prismic.io/gspann/e6d71615-0d41-4331-b3e5-a236a737909d_Image+10_+Importing+the+MongoDB+dashboard+into+Grafana.jpg?auto=compress,format" /></p>
<p><img style="padding: 0px 20px;" width="650px" height="auto" alt="Importing Json file" src="https://images.prismic.io/gspann/ef0ad585-485a-454d-a9d7-963b971878e6_Image+11_+Importing+Json+file.jpg?auto=compress,format" /></p>
<p>
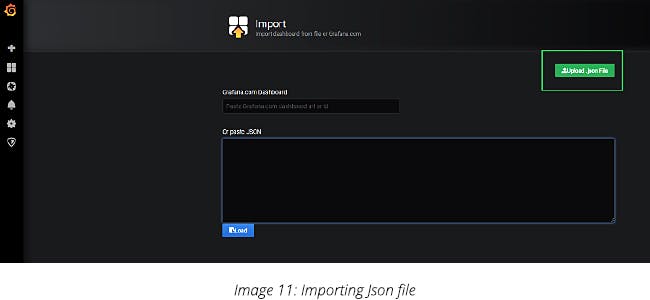
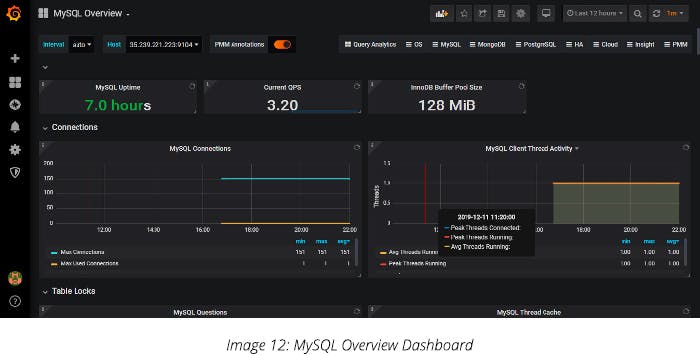
Finally, your dashboard will be imported with real-time updates of MySQL.
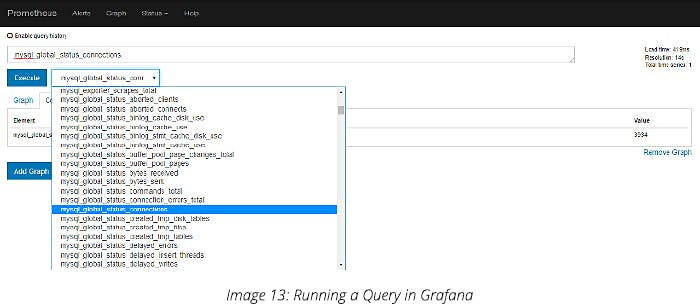
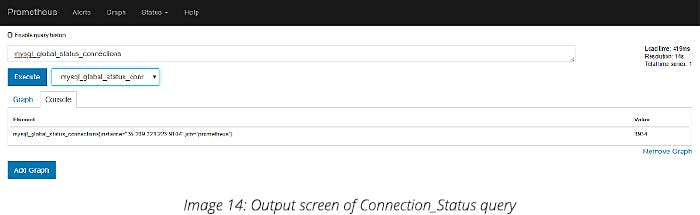
</p>
<p><img style="padding: 0px 20px;" width="700px" height="auto" alt="MySQL Overview Dashboard" src="https://images.prismic.io/gspann/84c14854-833b-4748-8de6-c4f8a6dea37d_Image+12_+MySQL+Overview+Dashboard.jpg?auto=compress,format" /></p>
<p>If you want to run a particular query: <strong>Go to Prometheus > click on Graph > click on insert metric: select the query in the drop-down menu that you want to execute > click on the execute button.</strong></p>
<p>For example, to run a query to know how many connections are there, we run a query as shown below:</p>
<p><img style="padding: 0px 20px;" width="700px" height="auto" alt="Running a Query in Grafana" src="https://images.prismic.io/gspann/d5cf7c83-5cf7-4bad-a70b-a010740039f8_Image+13_+Running+a+Query+in+Grafana.jpg?auto=compress,format" /></p>
<p>Output:</p>
<p>It will display how many users are there currently in MySQL</p>
<p><img style="padding: 0px 20px;" width="700px" height="auto" alt="Output screen of Connection_Status query" src="https://images.prismic.io/gspann/a928c4a1-e153-46d7-9696-0bdba135c5b1_Image+14_+Output+screen+of+Connection_Status+query.jpg?auto=compress,format" /></p>
<p>
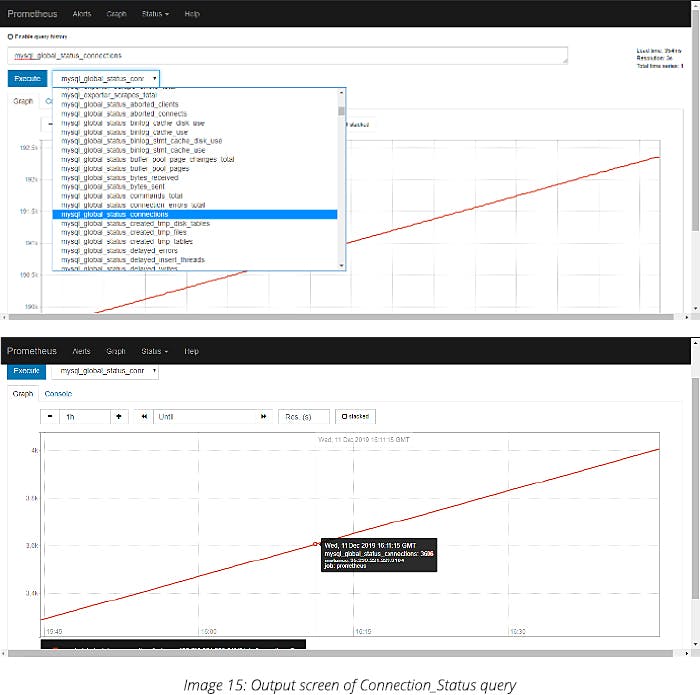
If you want a graph, click on the graph button, which will get executed as below:</p>
<p><img style="padding: 0px 20px;" width="700px" height="auto" alt="Output screen of Connection_Status query" src="https://images.prismic.io/gspann/b45339e5-069d-436a-98d0-2302f2841721_Image+15_+Output+screen+of+Connection_Status+query.jpg?auto=compress,format" /></p>
<p>In Grafana, you will see the output as shown below:</p>
<p><img style="padding: 0px 20px;" width="700px" height="auto" alt="Output screen of Connection_Status query" src="https://images.prismic.io/gspann/7b7c243e-1c9c-4d53-bc17-b76ba7d789d3_Image+16_+Output+screen+of+Connection_Status+query.jpg?auto=compress,format" /></p>
<p>
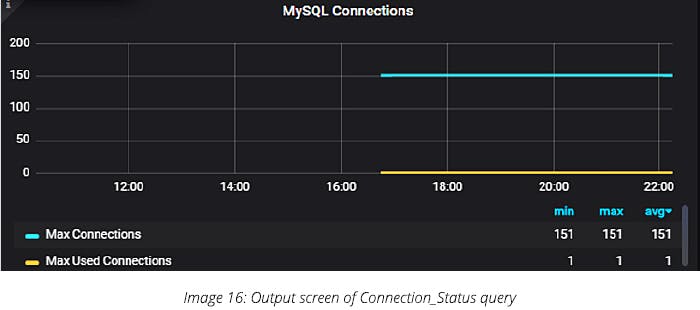
There are many database monitoring tools available for data visualization, but Grafana labs give more performance visibility compared to others. Grafana and Prometheus help us monitor not only database servers but also the applications that are running on virtual machines as well as containers.</p>