Prometheus is an open-source system that supports a multidimensional data model and turns metrics into actionable insights. It is widely adopted by businesses to monitor applications actively and send frequent alerts related to application deployment. It empowers developers to efficiently govern the project structure.
Download the Adobe Campaign Best Practices that Increase Your Marketing ROIWhite Paper
Resolving an application deployment issue requires intensive monitoring of its cause that leads to its solution. There are several monitoring tools available today; while some work with logs, others work with metrics. Prometheus is one of the best tools that performs metrics-based monitoring. It is a leading open-source metric instrumentation, collection, and storage toolkit that is built in the SoundCloud. It has graduated from being a Cloud Native Computing foundation to becoming the de facto standard for monitoring.
In this blog, we will concentrate on Prometheus architecture and collecting metrics of system information to develop a custom exporter. Also read about MySQL Database Monitoring with Grafana and Prometheus.
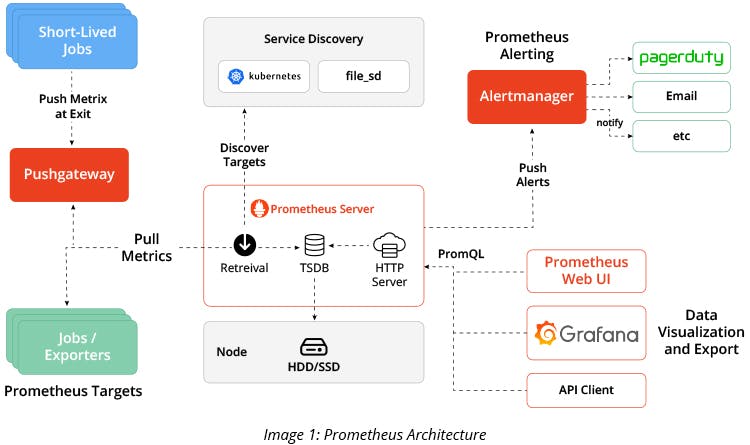
Prometheus Architecture
The major components of Prometheus come with Exporters, Push Gateway, and Web-UI. Exporters play a major role in presenting the application metrics over HTTP, while Push Gateway is used for post-application metrics over HTTP for shorter jobs. Web-UI, such as Grafana, is used to visualize the data that forms lines into a bar or line graphs.
Custom Exporter for Prometheus
Exporters available in the market will help you get the metrics of system information. But if you want a particular set of metrics that is not exposed to any exporter in the market, consider using Push Gateway, which is primarily used for short-lived jobs. It creates an endpoint on a specific port where the metrics can be pushed. In the next step, Prometheus scrapes the data from the port specified by Push Gateway.
Alternatively, you can consider developing your own Custom Exporter using programming languages, such as Go, Python, and more. This will help you get multiple metrics in one go, which is a complicated task in Push Gateway since it would require you to pass individual post requests for multiple metrics. By using a custom exporter, you can create an endpoint where metrics will be available to Prometheus for scraping.
Here is a sample script to help you develop Custom Exporter for Prometheus using Python:
class CustomCollector(object):     ## Class for CustomCollector which helps us
    				    to use different metric types
def __init__(self):
pass
def collect(self):
server_status = 1     ## place the logic here to get the server status
cpu_usage = 7  		  ## place the logic here to get the CPU Usage.
value = CounterMetricFamily("SERVER_STATUS", 'Help text', labels='value')
value.add_metric(["server_status"], server_status)
yield value
Above, we have used counter metrics that takes incremental numerical values. The Help text is used to divide metrics for better understanding of the usage. The labels are used to filter the data easily while retrieving.
value1 = GaugeMetricFamily("SERVER_STATUS", 'Help text', labels='value’)
value1.add_metric(["cpu_usage"], cpu_usage)
yield value1
Above, we have used gauge metrics that takes incremental/decremental numerical values. Help text is used to divide the metrics for better understanding of the usage. The labels are used to filter the data easily while retrieving.
if __name__ == '__main__':
start_http_server(8000)         ## port where metrics need to be exposed.
REGISTRY.register(CustomCollector())
while True:
time.sleep(30)		       ## To collect the metrics for every 30s.
These are four types of metrics wrapped up in a convenient client library that will help you develop a custom exporter:
- Counters: It displays a single numerical value and is mostly used for incremental values, like request count.
- Gauges: Like Counters, it displays single numerical values but it can be used for incremental and decremental values, such as CPU usage.
- Histograms: Histogram samples observation and counts them in configurable buckets. It is mainly used to take measurements of a value to calculate average or percentile later.
- Summary: Summaries also use the count and sum of the observations, such as Histogram. Additionally, it provides a quantile over time. With Histograms, a quantile is calculated on the Prometheus server. With Summaries, it is calculated on the application server.
Prometheus metrics facilitate a clean and mostly frictionless interface for operators, making code instrumentation easy and standardized. Libraries already exist for the most popular languages and the community is developing more. In addition, the labeling feature makes it a great choice for instrumenting custom metrics if you plan to use containers and microservices. You can even use other services like service discovers and alert the manager as an add-on.

Anurag Bhargav
Associate Software Engineer
Published Dec 04 2020