Tableau is a great collaboration platform that is intuitive in nature. It allows a user to build interesting and visually-rich workbooks and dashboards. Tableau is a powerful and high-performing visualization tool that allows many organizations to deliver scalable solutions and make better business decisions.
How Does Tableau Function?
Tableau is a data visualization tool that projects descriptive information about images and visuals. It has the most powerful feature to connect any data source or databases, including cloud services. It helps in transforming data into a dashboard or story for illustration. Tableau includes five products, named Tableau Reader, Tableau Public, Tableau Server, Tableau Online, and Tableau Desktop. You would require advanced calculation and analytical methods to develop visual reports to get an interactive dashboard on Tableau Desktop.
The Performance Recording feature in Tableau records performance information of key events as you interact with a workbook. You can view performance metrics in a workbook that Tableau creates to analyze and troubleshoot different events known to affect the performance, called Query execution. To analyze Tableau's performance, it is crucial to understand the functionality of Tableau visualization and architecture.
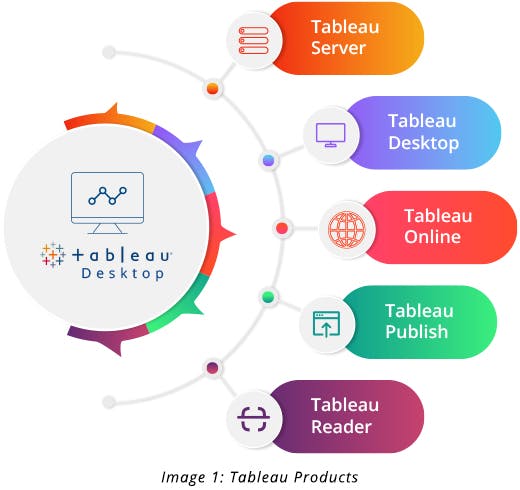
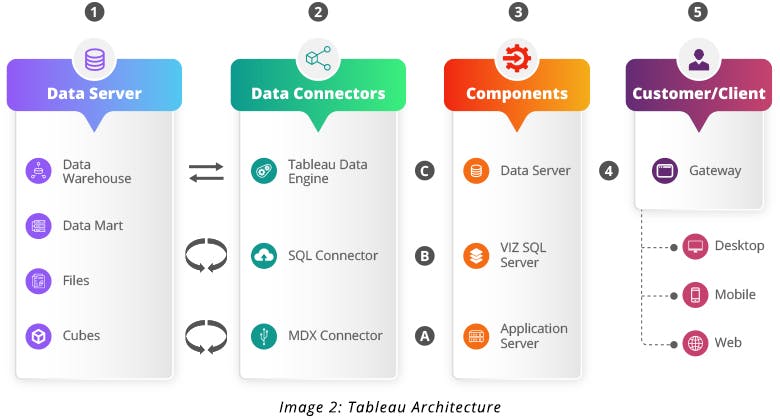
Tableau has an n-tier architecture and enterprise-class business analytics platform to connect the users with the components mentioned below:
1. Data Server: It has data sources from heterogeneous sources for Tableau desktop to capture analytical data visualizations, execute ad hoc queries, and help in decision-making. It also has data storage in the form of data marts, files, and cubes.
- Data Warehouse
- Data Marts
- Files
- Cubes
2. Data Connectors: They provide an interface to connect external data sources to Tableau data servers. Inbuilt Open Database Connectivity (ODBC) SQL connectors can connect to any database without using native connectors. Tableau data engine includes random-access memory (RAM), read-only memory (ROM), and cache memory.
- Multi-Dimensional Expressions (MDX) Connectors
- SQL Connectors
- Tableau Data Engine
3. Tableau Components: These components play an important role in Tableau visualization. VizQL server sends a query to the database and fetches the data for reports. Every time data hits the database, it creates a time lag, leaving a temporary space as a cache to reduce the execution load time. These data servers pull the data extracts and help in connectivity. An application server plays a role in authenticating users for data visibility.
- VizQL Server
- Data Server
- Application Server
4. Metadata Management: Metadata stores information for data security, data storage, and data calculation.
5. Gateway: It channelizes the request from the user to a Tableau component every time the client makes a request, forwarding it to an external load balancer for processing.
How to Optimize Tableau Performance?
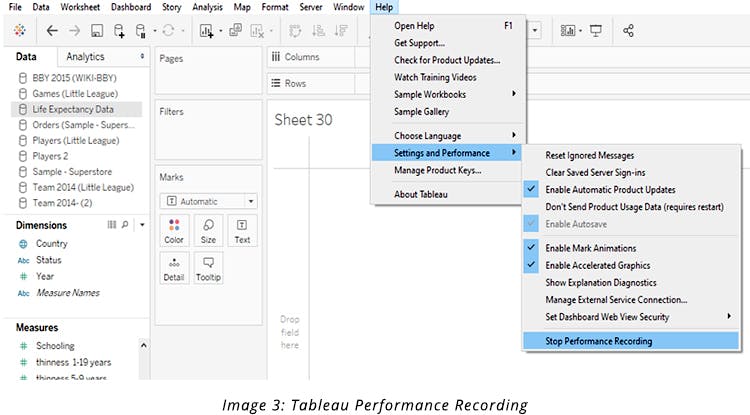
You can start by recording the performance. Go to Help > Settings and Performance > Start Performance Recording. The performance recorder can make you aware of the slow worksheets, slow queries, and long render time on dashboards. It will help in identifying query text for optimization at the database level.
Create Tableau to analyze and troubleshoot different events that are known to affect performance:
Query execution, query compilation, geocoding, connections to data sources, layout computations, extract generation, blending data, server rendering (Tableau Server only)
Data rendering is an important point of Tableau performance, initiated by taking a few precautionary measures to optimize Tableau performance and reports.
What is the Role of Indexes and How do They Improve Report Performance in Tableau?
Indexes improve query execution of the table when they join conditions, and these are executed for respected columns. Check indexes created on filters used by the report or requirement, along with primary and foreign keys. It’s important to conduct primary execution at the database level to check data performance.
To partition or not to partition
If you want to keep the live connection, it is recommended to split the database into multiple parts. If you moved every project data into its own table, you can bring the data back into Tableau using a wildcard union.
By using a partitioned database, the loading time is reduced to 13 seconds since the performance recorder calculates the time it takes to generate the extract and performs a comparison between the two as well.
Optimizing at the database level
Experts never recommend working on a live database connection. Although everyone is expected to eventually move on to an extract, there is a value in making Tableau optimization at the database level. In the current scenarios, developers are compelled to use live connections to expedite the extract durations. Tableau helps developers translate actions into SQL queries inside the performance reports. An SQL query is a lot easier to understand as opposed to XML ones used on Tableau extracts. However, it is important to make sure that queries always run in parallel.
Tableau data extract
It works faster with data extracts as it quickens query execution or optimization, ensuring faster data retrieval. You can limit the number of column usage by hiding and restricting the data using filters at the data extract level. A join in a custom query will end in slow downing the report, hence, it’s better to materialize the view at the database level.
Filters
Applying filters in a Tableau report and restricting the data also improves the report performance. Context filters expedite report execution and check for any changes. You can replace quick filters showing only relevant values that would cascade since the users interact and they perform faster. Select the "hide all unused fields" option from Tableau to exclude all unused fields from the extract while minimizing the extract refresh time and custom SQL query time.
Calculations
Calculations play another major role in the Tableau report performance. You must always use Boolean when the conditions Tableau are applied and, on the aggregation part, Min. or Max. instead of AVG. case statement for group visualizations, which would return a faster output. Try to create calculations at the database level when it is a production view. Limit the usage of marks on view, row-level calculations, and blended calculations.
Publishing
After publishing a dashboard to the Tableau Server, the local computation may impact the server. Thus, it’s best to limit the usage of groups, hierarchies, blending, table calculations, and reference lines. Table calculations are powerful and can be slowly performed as they are dependent on the Tableau engine.
Effective Ways of Building Interactive Tableau Dashboards
A well-designed dashboard can align an organization's efforts, help uncover key insights, and improve decision-making. It’s important to build an effective dashboard by using a strategic, operational, analytical, and tactical approach to reach the right audience.
Here are five principles of building an interactive Tableau dashboard:
1. Combining Reports
A dashboard offers key information and precise data. You can choose a dynamic layout where you can split the information into a segment for a proper and better understanding of the report.It’s recommended to avoid using automatic sizing to fix a dashboard size.
2. Provide Context
It’s important to provide a brief with a properly labeled axis on the dashboard. An effective designing tip for data comparison is required to compare data against targets, projected values, and date/period. An effective report would be easy for you to understand and read at the first glance. It’s also best to avoid using larger file images to reduce the loading time.
3. Custom SQL
You must avoid using custom SQL in live connections, rather, use views to implement custom SQL and connect Tableau to the view. Tableau creates sub-queries for custom SQL that are difficult for databases to handle, hence, it’s suggested to use views in the database or multiple joins instead of using custom SQL.
4. Limit the Number of Views
It is a good idea to limit the number of views you include in a dashboard to two or three. If you add too many views, you may lose visual clarity in the details. You can always create more dashboards to enhance the story scope, but too many views may interfere with the performance of your dashboard after it is published.
5. Enable Highlighting
The highlight button on the toolbar is used to show highlights between the views. When highlighting is on, a selection in one view highlights the related data in other views. The highlighter can be turned on for all fields or some specific selected fields.
You also have the option to display a highlighter that allows customers to highlight certain parts of a view, based on what they enter or select.
Endnote
A Tableau Server has powerful capabilities that govern the data sources, database connections, workbooks, and more through processes, but these capabilities can only be utilized when the Tableau is optimized for that kind of performance.
We, at GSPANN, have tested everything to find what works the best in different scenarios. However, explaining everything in a blog is like trying to capture a whole subject into a chapter. While we hope you get maximum value from this information, don’t hesitate to reach out to us.

Madhuri Gajjala
Technical Lead - IA
Published Oct 27 2020